Pottery Barn 2010 Annual Report Download - page 168
Download and view the complete annual report
Please find page 168 of the 2010 Pottery Barn annual report below. You can navigate through the pages in the report by either clicking on the pages listed below, or by using the keyword search tool below to find specific information within the annual report.-
 1
1 -
2
-
3
-
4
-
5
-
6
-
7
-
8
-
9
-
10
-
11
-
12
-
13
-
14
-
15
-
16
-
17
-
18
-
19
-
20
-
21
-
22
-
23
-
24
-
25
-
26
-
27
-
28
-
29
-
30
-
31
-
32
-
33
-
34
-
35
-
36
-
37
-
38
-
39
-
40
-
41
-
42
-
43
-
44
-
45
-
46
-
47
-
48
-
49
-
50
-
51
-
52
-
53
-
54
-
55
-
56
-
57
-
58
-
59
-
60
-
61
-
62
-
63
-
64
-
65
-
66
-
67
-
68
-
69
-
70
-
71
-
72
-
73
-
74
-
75
-
76
-
77
-
78
-
79
-
80
-
81
-
82
-
83
-
84
-
85
-
86
-
87
-
88
-
89
-
90
-
91
-
92
-
93
-
94
-
95
-
96
-
97
-
98
-
99
-
100
-
101
-
102
-
103
-
104
-
105
-
106
-
107
-
108
-
109
-
110
-
111
-
112
-
113
-
114
-
115
-
116
-
117
-
118
-
119
-
120
-
121
-
122
-
123
-
124
-
125
-
126
-
127
-
128
-
129
-
130
-
131
-
132
-
133
-
134
-
135
-
136
-
137
-
138
-
139
-
140
-
141
-
142
-
143
-
144
-
145
-
146
-
147
-
148
-
149
-
150
-
151
-
152
-
153
-
154
-
155
-
156
-
157
-
 158
158 -
 159
159 -
 160
160 -
 161
161 -
 162
162 -
 163
163 -
 164
164 -
 165
165 -
 166
166 -
 167
167 -
 168
168 -
 169
169 -
 170
170 -
 171
171 -
 172
172 -
 173
173 -
 174
174 -
 175
175 -
 176
176 -
 177
177 -
 178
178 -
179
-
180
-
181
-
182
-
183
-
184
-
185
-
186
-
187
-
188
-
189
-
190
-
191
-
192
-
193
-
194
-
195
-
196
-
197
-
198
-
199
-
200
-
201
-
202
-
203
-
204
-
205
-
206
-
207
-
208
-
209
-
210
-
211
-
212
-
213
-
214
-
215
-
216
-
217
-
218
-
219
-
220
-
221
-
222
-
223
-
224
-
225
-
226
-
227
-
228
-
229
-
230
-
231
-
232
-
233
-
234
-
235
-
236
-
237
-
238
-
239
-
240
-
241
-
242
-
243
-
244
-
245
-
246
-
247
-
248
-
249
-
250
-
251
-
252
 |
 |

companies, the current combinations of pay elements for each named executive officer and whether such
combinations were appropriate to provide incentives for achievement of desired results for the company. In fiscal
2009, as a result of the then-current economic climate, including the continued weakness of the retail industry,
the Compensation Committee recommended funding the Bonus Plan and using Bonus Plan targets at fiscal 2007
levels. As a result of this decision, the majority of the company’s named executive officers fell on average below
the 50th percentile compared to the company’s proxy peer group and relevant market data as described above in
target total cash compensation (as defined below). After considering market data for comparable companies and
a review of the respective responsibilities of the named executive officers, the current combinations of pay
elements for each named executive officer and whether such combinations were appropriate to create incentives
to achieve desired results for the company, the Compensation Committee determined that target bonuses as a
percentage of base salary should be increased for the named executive officers, including our then-incoming
Chief Executive Officer, Laura J. Alber, in fiscal 2010 (please see the chart below for fiscal 2009 and 2010 target
bonus amounts as a percentage of base salary).
The adjustments in Ms. Alber’s base salary and target bonus level (together, “target total cash compensation”)
followed an assessment of our proxy peer group data for chief executive officers. The adjustments result in target
total cash compensation for Ms. Alber slightly above the 50th percentile. For the remaining named executive
officers, the increases in base salaries as well as increases in the target bonus levels result in target total cash
compensation for fiscal 2010 increasing from generally below the 50th percentile to between the 50th percentile
and the 75th percentile compared to the company’s proxy peer group and relevant market data as described above.
However, Ms. McCollam’s target total cash compensation is significantly over the 75th percentile given the
importance of her role and her performance to the company. The Compensation Committee believes that
delivering a greater percentage of total cash compensation through incentive compensation reinforces the
company’s pay-for-performance strategy and aligns executive pay with shareholder interests by limiting the
growth of fixed base salaries and increasing at-risk pay.
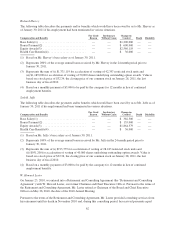
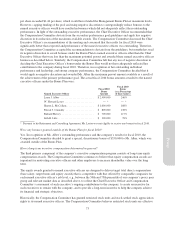
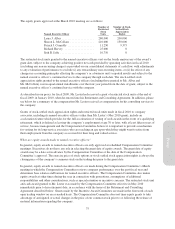
The target bonuses under the Bonus Plan for fiscal 2009 and 2010 are listed below for each named executive
officer:
Named Executive Officer
Fiscal 2009
Target Bonus
(as a Percentage
of Base Salary)
Fiscal 2010
Target Bonus
(as a Percentage
of Base Salary)
Laura J. Alber ...................... 50% 150%
W. Howard Lester .................. 100% — *
Sharon L. McCollam ................ 50% 125%
Patrick J. Connolly .................. 50% 75%
Richard Harvey .................... 50% 75%
Seth R. Jaffe ....................... 40% 60%
* Pursuant to his Retirement and Consulting Agreement, Mr. Lester was not eligible to receive any bonus for fiscal 2010.
What were the results for fiscal 2010 under the Bonus Plan?
Under the shareholder-approved Bonus Plan, no amounts were payable for fiscal 2010 unless the primary
performance goal was achieved. As mentioned above, during fiscal 2010, the company saw significant
improvements in both sales and earnings and did achieve the primary performance goal of positive net cash
provided by operating activities.
Since the Compensation Committee certified that the Bonus Plan’s fiscal 2010 primary performance goal was
achieved, it had discretion to award bonuses to the named executive officers under the plan in amounts up to
three times each executive’s base salary as of the beginning of the fiscal year.
In making its decision regarding bonuses, the Compensation Committee evaluated company performance and the
individual performance of the named executive officers. The Chief Executive Officer made recommendations to
the Compensation Committee based on her subjective assessment of each executive’s performance relative to
their roles and areas of responsibility. In fiscal 2010, achievement of the secondary performance goal of earnings
72