Pottery Barn 2010 Annual Report Download - page 52
Download and view the complete annual report
Please find page 52 of the 2010 Pottery Barn annual report below. You can navigate through the pages in the report by either clicking on the pages listed below, or by using the keyword search tool below to find specific information within the annual report.-
 1
1 -
2
-
3
-
4
-
5
-
6
-
7
-
8
-
9
-
10
-
11
-
12
-
13
-
14
-
15
-
16
-
17
-
18
-
19
-
20
-
21
-
22
-
23
-
24
-
25
-
26
-
27
-
28
-
29
-
30
-
31
-
32
-
33
-
34
-
35
-
36
-
37
-
38
-
39
-
40
-
41
-
 42
42 -
 43
43 -
 44
44 -
 45
45 -
 46
46 -
 47
47 -
 48
48 -
 49
49 -
 50
50 -
 51
51 -
 52
52 -
 53
53 -
 54
54 -
 55
55 -
 56
56 -
 57
57 -
 58
58 -
 59
59 -
 60
60 -
 61
61 -
 62
62 -
63
-
64
-
65
-
66
-
67
-
68
-
69
-
70
-
71
-
72
-
73
-
74
-
75
-
76
-
77
-
78
-
79
-
80
-
81
-
82
-
83
-
84
-
85
-
86
-
87
-
88
-
89
-
90
-
91
-
92
-
93
-
94
-
95
-
96
-
97
-
98
-
99
-
100
-
101
-
102
-
103
-
104
-
105
-
106
-
107
-
108
-
109
-
110
-
111
-
112
-
113
-
114
-
115
-
116
-
117
-
118
-
119
-
120
-
121
-
122
-
123
-
124
-
125
-
126
-
127
-
128
-
129
-
130
-
131
-
132
-
133
-
134
-
135
-
136
-
137
-
138
-
139
-
140
-
141
-
142
-
143
-
144
-
145
-
146
-
147
-
148
-
149
-
150
-
151
-
152
-
153
-
154
-
155
-
156
-
157
-
158
-
159
-
160
-
161
-
162
-
163
-
164
-
165
-
166
-
167
-
168
-
169
-
170
-
171
-
172
-
173
-
174
-
175
-
176
-
177
-
178
-
179
-
180
-
181
-
182
-
183
-
184
-
185
-
186
-
187
-
188
-
189
-
190
-
191
-
192
-
193
-
194
-
195
-
196
-
197
-
198
-
199
-
200
-
201
-
202
-
203
-
204
-
205
-
206
-
207
-
208
-
209
-
210
-
211
-
212
-
213
-
214
-
215
-
216
-
217
-
218
-
219
-
220
-
221
-
222
-
223
-
224
-
225
-
226
-
227
-
228
-
229
-
230
-
231
-
232
-
233
-
234
-
235
-
236
-
237
-
238
-
239
-
240
-
241
-
242
-
243
-
244
-
245
-
246
-
247
-
248
-
249
-
250
-
251
-
252
 |
 |
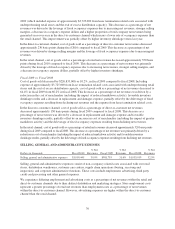
their expected period of future benefit. Such amortization is based upon the ratio of actual revenues to the total of
actual and estimated future revenues on an individual catalog basis. Estimated future revenues are based upon
various factors such as the total number of catalogs and pages circulated, the probability and magnitude of
consumer response and the assortment of merchandise offered. Each catalog is generally fully amortized over a
six to nine month period, with the majority of the amortization occurring within the first four to five months.
Prepaid catalog expenses are evaluated for realizability on a monthly basis by comparing the carrying amount
associated with each catalog to the estimated probable remaining future profitability (remaining net revenues less
merchandise cost of goods sold, selling expenses and catalog-related costs) associated with that catalog. If the
catalog is not expected to be profitable, the carrying amount of the catalog is impaired accordingly.
Property and Equipment
Property and equipment is stated at cost. Depreciation is computed using the straight-line method over the
estimated useful lives of the assets.
We review the carrying value of all long-lived assets for impairment, primarily at a store level, whenever events or
changes in circumstances indicate that the carrying value of an asset may not be recoverable. We review for
impairment all stores for which current or projected cash flows from operations are not sufficient to recover the
carrying value of the assets. Impairment results when the carrying value of the assets exceeds the estimated
undiscounted future cash flows over the remaining life of the lease. Our estimate of undiscounted future cash flows
over the store lease term (generally 5 to 22 years) is based upon our experience, historical operations of the stores
and estimates of future store profitability and economic conditions. The future estimates of store profitability and
economic conditions require estimating such factors as sales growth, gross margin, employment rates, lease
escalations, inflation on operating expenses and the overall economics of the retail industry and are therefore subject
to variability and difficult to predict. If a long-lived asset is found to be impaired, the amount recognized for
impairment is equal to the difference between the net carrying value and the asset’s fair value. Long-lived assets are
measured at fair value on a nonrecurring basis using Level 3 inputs as defined in the fair value hierarchy. The fair
value is estimated based upon future cash flows (discounted at a rate that is commensurate with the risk and
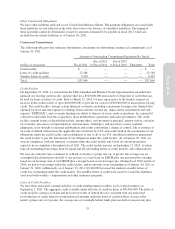
approximates our weighted average cost of capital). We recorded impairment charges related to our
underperforming retail stores of $5,128,000, $28,941,000 and $33,995,000 in selling, general and administrative
expenses in fiscal 2010, fiscal 2009 and fiscal 2008, respectively.
Self-Insured Liabilities
We are primarily self-insured for workers’ compensation, employee health benefits and product and general
liability claims. We record self-insurance liabilities based on claims filed, including the development of those
claims, and an estimate of claims incurred but not yet reported. Factors affecting this estimate include future
inflation rates, changes in severity, benefit level changes, medical costs and claim settlement patterns. Should a
different amount of claims occur compared to what was estimated, or costs of the claims increase or decrease
beyond what was anticipated, reserves may need to be adjusted accordingly. We determine our workers’
compensation liability and product and general liability claims reserves based on an actuarial analysis of
historical claims data. Self-insurance reserves for employee health benefits, workers’ compensation and product
and general liability claims were $19,122,000 and $20,111,000 as of January 30, 2011 and January 31, 2010,
respectively, and are recorded within Accrued Salaries, Benefits and Other on our Consolidated Balance Sheets.
Customer Deposits
Customer deposits are primarily comprised of unredeemed gift cards, gift certificates, and merchandise credits
and deferred revenue related to undelivered merchandise. We maintain a liability for unredeemed gift cards, gift
certificates and merchandise credits until the earlier of redemption, escheatment or four years as we have
concluded that the likelihood of our gift cards and gift certificates being redeemed beyond four years from the
date of issuance is remote.
38