Pottery Barn 2010 Annual Report Download - page 61
Download and view the complete annual report
Please find page 61 of the 2010 Pottery Barn annual report below. You can navigate through the pages in the report by either clicking on the pages listed below, or by using the keyword search tool below to find specific information within the annual report.-
 1
1 -
2
-
3
-
4
-
5
-
6
-
7
-
8
-
9
-
10
-
11
-
12
-
13
-
14
-
15
-
16
-
17
-
18
-
19
-
20
-
21
-
22
-
23
-
24
-
25
-
26
-
27
-
28
-
29
-
30
-
31
-
32
-
33
-
34
-
35
-
36
-
37
-
38
-
39
-
40
-
41
-
42
-
43
-
44
-
45
-
46
-
47
-
48
-
49
-
50
-
 51
51 -
 52
52 -
 53
53 -
 54
54 -
 55
55 -
 56
56 -
 57
57 -
 58
58 -
 59
59 -
 60
60 -
 61
61 -
 62
62 -
 63
63 -
 64
64 -
 65
65 -
 66
66 -
 67
67 -
 68
68 -
 69
69 -
 70
70 -
 71
71 -
72
-
73
-
74
-
75
-
76
-
77
-
78
-
79
-
80
-
81
-
82
-
83
-
84
-
85
-
86
-
87
-
88
-
89
-
90
-
91
-
92
-
93
-
94
-
95
-
96
-
97
-
98
-
99
-
100
-
101
-
102
-
103
-
104
-
105
-
106
-
107
-
108
-
109
-
110
-
111
-
112
-
113
-
114
-
115
-
116
-
117
-
118
-
119
-
120
-
121
-
122
-
123
-
124
-
125
-
126
-
127
-
128
-
129
-
130
-
131
-
132
-
133
-
134
-
135
-
136
-
137
-
138
-
139
-
140
-
141
-
142
-
143
-
144
-
145
-
146
-
147
-
148
-
149
-
150
-
151
-
152
-
153
-
154
-
155
-
156
-
157
-
158
-
159
-
160
-
161
-
162
-
163
-
164
-
165
-
166
-
167
-
168
-
169
-
170
-
171
-
172
-
173
-
174
-
175
-
176
-
177
-
178
-
179
-
180
-
181
-
182
-
183
-
184
-
185
-
186
-
187
-
188
-
189
-
190
-
191
-
192
-
193
-
194
-
195
-
196
-
197
-
198
-
199
-
200
-
201
-
202
-
203
-
204
-
205
-
206
-
207
-
208
-
209
-
210
-
211
-
212
-
213
-
214
-
215
-
216
-
217
-
218
-
219
-
220
-
221
-
222
-
223
-
224
-
225
-
226
-
227
-
228
-
229
-
230
-
231
-
232
-
233
-
234
-
235
-
236
-
237
-
238
-
239
-
240
-
241
-
242
-
243
-
244
-
245
-
246
-
247
-
248
-
249
-
250
-
251
-
252
 |
 |

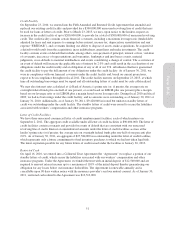
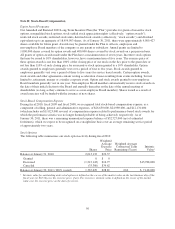
We review the carrying value of all long-lived assets for impairment, primarily at a store level, whenever events
or changes in circumstances indicate that the carrying value of an asset may not be recoverable. We review for
impairment all stores for which current or projected cash flows from operations are not sufficient to recover the
carrying value of the assets. Impairment results when the carrying value of the assets exceeds the estimated
undiscounted future cash flows over the remaining life of the lease. Our estimate of undiscounted future cash
flows over the store lease term (generally 5 to 22 years) is based upon our experience, historical operations of the
stores and estimates of future store profitability and economic conditions. The future estimates of store
profitability and economic conditions require estimating such factors as sales growth, gross margin, employment
rates, lease escalations, inflation on operating expenses and the overall economics of the retail industry, and are
therefore subject to variability and difficult to predict. If a long-lived asset is found to be impaired, the amount
recognized for impairment is equal to the difference between the net carrying value and the asset’s fair value.
Long-lived assets are measured at fair value on a nonrecurring basis using Level 3 inputs as defined in the fair
value hierarchy. The fair value is estimated based upon future cash flows (discounted at a rate that is
commensurate with the risk and approximates our weighted average cost of capital).
For any store or facility closure where a lease obligation still exists, we record the estimated future liability
associated with the rental obligation on the cease use date.
During fiscal 2010, we recorded expense of approximately $17,525,000 associated with asset impairment and
early lease termination charges for underperforming retail stores, of which $16,384,000 is recorded within
selling, general and administrative expenses, and the remainder of which is recorded within cost of goods sold.
We also recorded a net benefit of $403,000 associated with the exit of excess distribution capacity, which is
recorded within selling, general and administrative expenses.
During fiscal 2009, we recorded expense of approximately $35,024,000 associated with asset impairment and
early lease termination charges for underperforming retail stores, of which $32,898,000 is recorded within
selling, general and administrative expenses, and the remainder of which is recorded within cost of goods sold.
We also recorded charges of $7,580,000 associated with the exit of excess distribution capacity, of which
$5,981,000 is recorded within selling, general and administrative expenses, and the remainder of which is
recorded within cost of goods sold.
During fiscal 2008, we recorded expense of approximately $33,995,000 associated with asset impairment charges
for underperforming retail stores, all of which is recorded within selling, general and administrative expenses. In
addition, during fiscal 2008, we recorded a benefit of approximately $9,350,000 within selling, general and
administrative expenses related to an incentive payment received from a landlord to compensate us for
terminating a store lease prior to its expiration.
Self-Insured Liabilities
We are primarily self-insured for workers’ compensation, employee health benefits and product and general
liability claims. We record self-insurance liabilities based on claims filed, including the development of those
claims, and an estimate of claims incurred but not yet reported. Factors affecting this estimate include future
inflation rates, changes in severity, benefit level changes, medical costs and claim settlement patterns. Should a
different amount of claims occur compared to what was estimated, or costs of the claims increase or decrease
beyond what was anticipated, reserves may need to be adjusted accordingly. We determine our workers’
compensation liability and product and general liability claims reserves based on an actuarial analysis of
historical claims data. Self-insurance reserves for employee health benefits, workers’ compensation and product
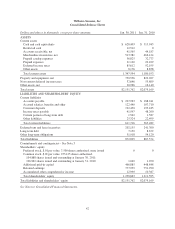
and general liability claims were $19,122,000 and $20,111,000 as of January 30, 2011 and January 31, 2010,
respectively, and are recorded within accrued salaries, benefits and other.
Customer Deposits
Customer deposits are primarily comprised of unredeemed gift cards, gift certificates, and merchandise credits and
deferred revenue related to undelivered merchandise. We maintain a liability for unredeemed gift cards, gift certificates,
and merchandise credits until the earlier of redemption, escheatment or four years as we have concluded that the
likelihood of our gift cards and gift certificates being redeemed beyond four years from the date of issuance is remote.
47
Form 10-K