Pottery Barn 2010 Annual Report Download - page 51
Download and view the complete annual report
Please find page 51 of the 2010 Pottery Barn annual report below. You can navigate through the pages in the report by either clicking on the pages listed below, or by using the keyword search tool below to find specific information within the annual report.-
 1
1 -
2
-
3
-
4
-
5
-
6
-
7
-
8
-
9
-
10
-
11
-
12
-
13
-
14
-
15
-
16
-
17
-
18
-
19
-
20
-
21
-
22
-
23
-
24
-
25
-
26
-
27
-
28
-
29
-
30
-
31
-
32
-
33
-
34
-
35
-
36
-
37
-
38
-
39
-
40
-
 41
41 -
 42
42 -
 43
43 -
 44
44 -
 45
45 -
 46
46 -
 47
47 -
 48
48 -
 49
49 -
 50
50 -
 51
51 -
 52
52 -
 53
53 -
 54
54 -
 55
55 -
 56
56 -
 57
57 -
 58
58 -
 59
59 -
 60
60 -
 61
61 -
62
-
63
-
64
-
65
-
66
-
67
-
68
-
69
-
70
-
71
-
72
-
73
-
74
-
75
-
76
-
77
-
78
-
79
-
80
-
81
-
82
-
83
-
84
-
85
-
86
-
87
-
88
-
89
-
90
-
91
-
92
-
93
-
94
-
95
-
96
-
97
-
98
-
99
-
100
-
101
-
102
-
103
-
104
-
105
-
106
-
107
-
108
-
109
-
110
-
111
-
112
-
113
-
114
-
115
-
116
-
117
-
118
-
119
-
120
-
121
-
122
-
123
-
124
-
125
-
126
-
127
-
128
-
129
-
130
-
131
-
132
-
133
-
134
-
135
-
136
-
137
-
138
-
139
-
140
-
141
-
142
-
143
-
144
-
145
-
146
-
147
-
148
-
149
-
150
-
151
-
152
-
153
-
154
-
155
-
156
-
157
-
158
-
159
-
160
-
161
-
162
-
163
-
164
-
165
-
166
-
167
-
168
-
169
-
170
-
171
-
172
-
173
-
174
-
175
-
176
-
177
-
178
-
179
-
180
-
181
-
182
-
183
-
184
-
185
-
186
-
187
-
188
-
189
-
190
-
191
-
192
-
193
-
194
-
195
-
196
-
197
-
198
-
199
-
200
-
201
-
202
-
203
-
204
-
205
-
206
-
207
-
208
-
209
-
210
-
211
-
212
-
213
-
214
-
215
-
216
-
217
-
218
-
219
-
220
-
221
-
222
-
223
-
224
-
225
-
226
-
227
-
228
-
229
-
230
-
231
-
232
-
233
-
234
-
235
-
236
-
237
-
238
-
239
-
240
-
241
-
242
-
243
-
244
-
245
-
246
-
247
-
248
-
249
-
250
-
251
-
252
 |
 |

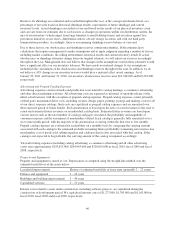
IMPACT OF INFLATION
The impact of inflation (or deflation) on our results of operations for the past three fiscal years has not been
significant. In light of the recent economic environment, however, we cannot be certain of the effect inflation (or
deflation) may have on our results of our operations in the future.
CRITICAL ACCOUNTING POLICIES
Management’s Discussion and Analysis of Financial Condition and Results of Operations is based on our
consolidated financial statements, which have been prepared in accordance with accounting principles generally
accepted in the United States of America. The preparation of these financial statements requires us to make
estimates and assumptions that affect the reported amounts of assets, liabilities, revenues and expenses and
related disclosures of contingent assets and liabilities. These estimates and assumptions are evaluated on an
ongoing basis and are based on historical experience and various other factors that we believe to be reasonable
under the circumstances. Actual results could differ from these estimates.
We believe the following critical accounting policies affect the significant estimates and assumptions used in the
preparation of our consolidated financial statements.
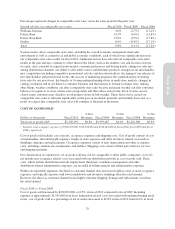
Merchandise Inventories
Merchandise inventories, net of an allowance for excess quantities and obsolescence, are stated at the lower of
cost (weighted average method) or market. To determine if the value of our inventory should be marked down
below cost, we consider current and anticipated demand, customer preferences, age of the merchandise and
fashion trends. Our inventory value is adjusted periodically to reflect current market conditions, which requires
management judgments that may significantly affect the ending inventory valuation, as well as gross margin. The
significant estimates used in inventory valuation are obsolescence (including excess and slow-moving inventory
and lower of cost or market reserves) and estimates of inventory shrinkage. We reserve for obsolescence based
on historical trends, aging reports, specific identification and our estimates of future retail sales prices.
Reserves for shrinkage are estimated and recorded throughout the year, at the concept and channel level, as a
percentage of net sales based on historical shrinkage results, expectations of future shrinkage and current
inventory levels. Actual shrinkage is recorded at year-end based on the results of our physical inventory count
and can vary from our estimates due to such factors as changes in operations within our distribution centers, the
mix of our inventory (which ranges from large furniture to small tabletop items) and execution against loss
prevention initiatives in our stores, distribution centers, off-site storage locations, and with our third-party
transportation providers. Accordingly, there is no remaining shrinkage reserve balance at year-end.
Due to these factors, our obsolescence and shrinkage reserves contain uncertainties. Both estimates have
calculations that require management to make assumptions and to apply judgment regarding a number of factors,
including market conditions, the selling environment, historical results and current inventory trends. If actual
obsolescence or shrinkage estimates change from our original estimate, we will adjust our reserves accordingly
throughout the year. Management does not believe that changes in the assumptions used in these estimates would
have a significant effect on our inventory balances. We have made no material changes to our assumptions
included in the calculations of the obsolescence and shrinkage reserves throughout the year. In addition, we do
not believe a 10% change in our inventory reserves would have a material effect on net earnings. As of
January 30, 2011 and January 31, 2010, our inventory obsolescence reserves were $12,348,000 and $18,565,000,
respectively.
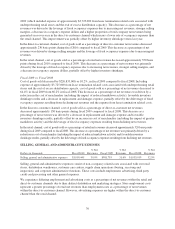
Advertising and Prepaid Catalog Expenses
Advertising expenses consist of media and production costs related to catalog mailings, e-commerce advertising
and other direct marketing activities. All advertising costs are expensed as incurred, or upon the release of the
initial advertisement, with the exception of prepaid catalog expenses. Prepaid catalog expenses consist primarily
of third party incremental direct costs, including creative design, paper, printing, postage and mailing costs for all
of our direct response catalogs. Such costs are capitalized as prepaid catalog expenses and are amortized over
37
Form 10-K