Pitney Bowes 2012 Annual Report Download - page 99
Download and view the complete annual report
Please find page 99 of the 2012 Pitney Bowes annual report below. You can navigate through the pages in the report by either clicking on the pages listed below, or by using the keyword search tool below to find specific information within the annual report.-
 1
1 -
2
-
3
-
4
-
5
-
6
-
7
-
8
-
9
-
10
-
11
-
12
-
13
-
14
-
15
-
16
-
17
-
18
-
19
-
20
-
21
-
22
-
23
-
24
-
25
-
26
-
27
-
28
-
29
-
30
-
31
-
32
-
33
-
34
-
35
-
36
-
37
-
38
-
39
-
40
-
41
-
42
-
43
-
44
-
45
-
46
-
47
-
48
-
49
-
50
-
51
-
52
-
53
-
54
-
55
-
56
-
57
-
58
-
59
-
60
-
61
-
62
-
63
-
64
-
65
-
66
-
67
-
68
-
69
-
70
-
71
-
72
-
73
-
74
-
75
-
76
-
77
-
78
-
79
-
80
-
81
-
82
-
83
-
84
-
85
-
86
-
87
-
88
-
 89
89 -
 90
90 -
 91
91 -
 92
92 -
 93
93 -
 94
94 -
 95
95 -
 96
96 -
 97
97 -
 98
98 -
 99
99 -
 100
100 -
 101
101 -
 102
102 -
 103
103 -
 104
104 -
 105
105 -
 106
106 -
 107
107 -
 108
108 -
 109
109 -
110
-
111
-
112
-
113
-
114
-
115
-
116
 |
 |

PITNEY BOWES INC.
NOTES TO CONSOLIDATED FINANCIAL STATEMENTS
(Tabular dollars in thousands, except per share amounts)
81
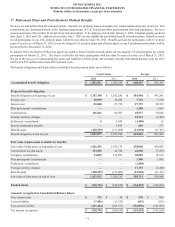
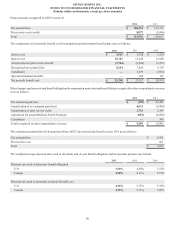
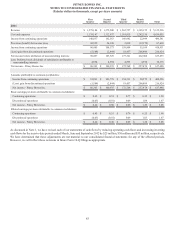
The assumed health care cost trend rate used in measuring the accumulated postretirement benefit obligation for the U.S. plan was 7.50%
for 2012 and 7.50% for 2011. The assumed health care trend rate is 7.00% for 2013 and will gradually decline to 5.0% by the year 2017
and remain at that level thereafter. Assumed health care cost trend rates have a significant effect on the amounts reported for the health
care plans. A 1% change in the assumed health care cost trend rates would have the following effects:
1% Increase 1% Decrease
Effect on total of service and interest cost components 573 (477)
Effect on postretirement benefit obligation 10,086 (8,703)
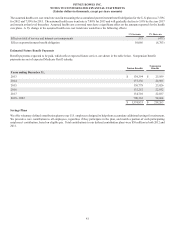
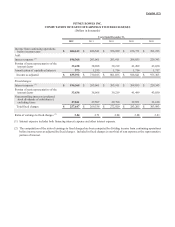
Estimated Future Benefit Payments
Pension Benefits
Nonpension
Benefits
Years ending December 31,
2013 $ 139,394 $ 25,959
2014 137,336 24,905
2015 130,778 23,826
2016 132,252 22,932
2017 134,710 22,037
2018 - 2022 700,363 98,604
$ 1,374,833 $ 218,263
Savings Plans
We offer voluntary defined contribution plans to our U.S. employees designed to help them accumulate additional savings for retirement.
We provide a core contribution to all employees, regardless if they participate in the plan, and match a portion of each participating
employees' contribution, based on eligible pay. Total contributions to our defined contribution plans were $30 million in both 2012 and
2011.
Benefit payments expected to be paid, which reflect expected future service, are shown in the table below. Nonpension benefit
payments are net of expected Medicare Part D subsidy.