Pitney Bowes 2012 Annual Report Download - page 32
Download and view the complete annual report
Please find page 32 of the 2012 Pitney Bowes annual report below. You can navigate through the pages in the report by either clicking on the pages listed below, or by using the keyword search tool below to find specific information within the annual report.-
 1
1 -
2
-
3
-
4
-
5
-
6
-
7
-
8
-
9
-
10
-
11
-
12
-
13
-
14
-
15
-
16
-
17
-
18
-
19
-
20
-
21
-
 22
22 -
 23
23 -
 24
24 -
 25
25 -
 26
26 -
 27
27 -
 28
28 -
 29
29 -
 30
30 -
 31
31 -
 32
32 -
 33
33 -
 34
34 -
 35
35 -
 36
36 -
 37
37 -
 38
38 -
 39
39 -
 40
40 -
 41
41 -
 42
42 -
43
-
44
-
45
-
46
-
47
-
48
-
49
-
50
-
51
-
52
-
53
-
54
-
55
-
56
-
57
-
58
-
59
-
60
-
61
-
62
-
63
-
64
-
65
-
66
-
67
-
68
-
69
-
70
-
71
-
72
-
73
-
74
-
75
-
76
-
77
-
78
-
79
-
80
-
81
-
82
-
83
-
84
-
85
-
86
-
87
-
88
-
89
-
90
-
91
-
92
-
93
-
94
-
95
-
96
-
97
-
98
-
99
-
100
-
101
-
102
-
103
-
104
-
105
-
106
-
107
-
108
-
109
-
110
-
111
-
112
-
113
-
114
-
115
-
116
 |
 |

14
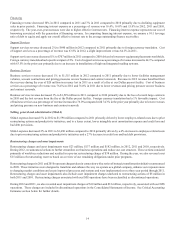
Financing
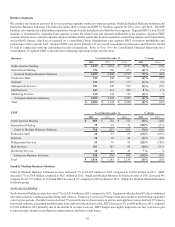
Financing revenue decreased 10% in 2012 compared to 2011 and 7% in 2011 compared to 2010 primarily due to declining equipment
sales in prior periods. Financing interest expense as a percentage of revenue was 16.4%, 16.0% and 15.0% in 2012, 2011 and 2010,
respectively. The year-over-year increases were due to higher effective interest rates. Financing interest expense represents our cost of
borrowing associated with the generation of financing revenue. In computing financing interest expense, we assume a 10:1 leverage
ratio of debt to equity and apply our overall effective interest rate to the average outstanding finance receivables.
Support Services
Support services revenue decreased 2% to $690 million in 2012 compared to 2011 primarily due to foreign currency translation. Cost
of support services as a percentage of revenue was 63.8% in 2012, a slight improvement versus 64.1% in 2011.
Support services revenue decreased 1% to $707 million in 2011 compared to 2010 driven by lower new equipment placements worldwide.
Foreign currency translation had a positive impact of 2%. Cost of support services as a percentage of revenue increased to 64.1% compared
with 63.5% in the prior year primarily due to an increase in installations of high-end integrated mailing systems.
Business Services
Business services revenue decreased 1% to $1,515 million in 2012 compared to 2011 primarily due to lower facilities management
volumes, account contractions and pricing pressures on new business and contract renewals. Revenue in 2012 revenue benefited from
the recovery during the year of $20 million in revenue lost in 2011 as a result of a fire at our Dallas presort facility. Cost of business
services as a percentage of revenue was 76.4% in 2012 and 76.0% in 2011 due to lower revenues and pricing pressure on new business
and contract renewals.
Business services revenue decreased 3% to $1,529 million in 2011 compared to 2010 primarily due to the loss of several large contracts
in 2010 and the lost revenue from the fire at the Dallas presort facility. Foreign currency translation had a 1% favorable impact. Cost
of business services as a percentage of revenue increased to 76.0% compared with 74.3% in the prior year primarily due to lower revenues
and pricing pressure on new business and contract renewals.
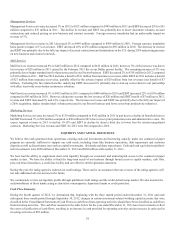
Selling, general and administrative (SG&A)
SG&A expense decreased 5% in 2012 to $1,598 million compared to 2011 primarily driven by lower employee-related costs due to prior
restructuring actions and productivity initiatives, and to a lesser extent, lower intangible asset amortization expense and credit loss and
bad debt provisions.
SG&A expense decreased 2% in 2011 to $1,690 million compared to 2010 primarily driven by a 4% decrease in employee-related costs
due to prior restructuring actions and productivity initiatives and a 27% decrease in credit loss and bad debt provisions.
Restructuring charges and asset impairments
Restructuring charges and asset impairments were $23 million, $137 million and $182 million, in 2012, 2011 and 2010, respectively.
During 2012, we announced actions to further streamline our business operations and reduce our cost structure. These actions consisted
primarily of workforce reductions and resulted in a pre-tax restructuring charge of $38 million. During the year, we also reversed a net
$15 million of restructuring reserves based on a review of our remaining obligations under prior programs.
Restructuring charges in 2011 and 2010 represent charges taken in connection with a series of strategic transformation initiatives announced
in 2009. These initiatives were designed to transform and enhance the way we operate as a global company, enhance our responsiveness
to changing market conditions and create improved processes and systems and were implemented over a three year period through 2011.
Restructuring charges and asset impairments also include asset impairment charges unrelated to restructuring actions of $5 million in
both 2011 and 2010. Restructuring charges associated with our IMS operations have been reclassified as discontinued operations.
During 2012 and 2011, we also recorded asset impairment charges of $10 million and $12 million, respectively, associated with our IMS
operations. These charges are included in discontinued operations in the Consolidated Statements of Income. See Critical Accounting
Estimates section below for further details.