Pitney Bowes 2012 Annual Report Download - page 63
Download and view the complete annual report
Please find page 63 of the 2012 Pitney Bowes annual report below. You can navigate through the pages in the report by either clicking on the pages listed below, or by using the keyword search tool below to find specific information within the annual report.-
 1
1 -
2
-
3
-
4
-
5
-
6
-
7
-
8
-
9
-
10
-
11
-
12
-
13
-
14
-
15
-
16
-
17
-
18
-
19
-
20
-
21
-
22
-
23
-
24
-
25
-
26
-
27
-
28
-
29
-
30
-
31
-
32
-
33
-
34
-
35
-
36
-
37
-
38
-
39
-
40
-
41
-
42
-
43
-
44
-
45
-
46
-
47
-
48
-
49
-
50
-
51
-
52
-
 53
53 -
 54
54 -
 55
55 -
 56
56 -
 57
57 -
 58
58 -
 59
59 -
 60
60 -
 61
61 -
 62
62 -
 63
63 -
 64
64 -
 65
65 -
 66
66 -
 67
67 -
 68
68 -
 69
69 -
 70
70 -
 71
71 -
 72
72 -
 73
73 -
74
-
75
-
76
-
77
-
78
-
79
-
80
-
81
-
82
-
83
-
84
-
85
-
86
-
87
-
88
-
89
-
90
-
91
-
92
-
93
-
94
-
95
-
96
-
97
-
98
-
99
-
100
-
101
-
102
-
103
-
104
-
105
-
106
-
107
-
108
-
109
-
110
-
111
-
112
-
113
-
114
-
115
-
116
 |
 |

PITNEY BOWES INC.
NOTES TO CONSOLIDATED FINANCIAL STATEMENTS
(Tabular dollars in thousands, except per share amounts)
45
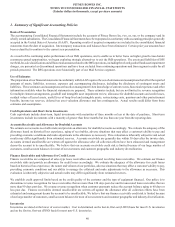
claim or legal action is considered probable and can be reasonably estimated, we establish a liability for the estimated loss. The assessment
of the ultimate outcome of each claim or legal action and the determination of the potential financial exposure requires significant
judgment. Estimates of potential liabilities for claims or legal actions are based only on information that is available at that time. As
additional information becomes available, we may revise our estimates, and these revisions could have a material impact on our results
of operations and financial position. Legal fees are expensed as incurred.
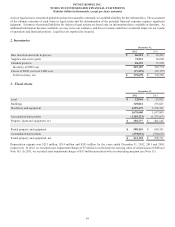
2. Inventories
December 31,
2012 2011
Raw materials and work in process $ 66,221 $ 63,216
Supplies and service parts 72,551 68,600
Finished products 68,335 71,958
Inventory at FIFO cost 207,107 203,774
Excess of FIFO cost over LIFO cost (27,429)(25,175)
Total inventory, net $ 179,678 $ 178,599
3. Fixed Assets
December 31,
2012 2011
Land $ 22,064 $ 23,852
Buildings 349,061 335,625
Machinery and equipment 1,299,475 1,278,332
1,670,600 1,637,809
Accumulated depreciation (1,285,223)(1,233,663)
Property, plant and equipment, net $ 385,377 $ 404,146
Rental property and equipment $ 580,243 $ 649,343
Accumulated depreciation (339,051)(390,632)
Rental property and equipment, net $ 241,192 $ 258,711
Depreciation expense was $211 million, $214 million and $243 million for the years ended December 31, 2012, 2011 and 2010,
respectively. In 2012, we recorded asset impairment charges of $7 million to write down the carrying value of certain assets of IMS (see
Note 18). In 2011, we recorded asset impairment charges of $13 million associated with a restructuring program (see Note 13).