Pitney Bowes 2012 Annual Report Download - page 88
Download and view the complete annual report
Please find page 88 of the 2012 Pitney Bowes annual report below. You can navigate through the pages in the report by either clicking on the pages listed below, or by using the keyword search tool below to find specific information within the annual report.-
 1
1 -
2
-
3
-
4
-
5
-
6
-
7
-
8
-
9
-
10
-
11
-
12
-
13
-
14
-
15
-
16
-
17
-
18
-
19
-
20
-
21
-
22
-
23
-
24
-
25
-
26
-
27
-
28
-
29
-
30
-
31
-
32
-
33
-
34
-
35
-
36
-
37
-
38
-
39
-
40
-
41
-
42
-
43
-
44
-
45
-
46
-
47
-
48
-
49
-
50
-
51
-
52
-
53
-
54
-
55
-
56
-
57
-
58
-
59
-
60
-
61
-
62
-
63
-
64
-
65
-
66
-
67
-
68
-
69
-
70
-
71
-
72
-
73
-
74
-
75
-
76
-
77
-
 78
78 -
 79
79 -
 80
80 -
 81
81 -
 82
82 -
 83
83 -
 84
84 -
 85
85 -
 86
86 -
 87
87 -
 88
88 -
 89
89 -
 90
90 -
 91
91 -
 92
92 -
 93
93 -
 94
94 -
 95
95 -
 96
96 -
 97
97 -
 98
98 -
99
-
100
-
101
-
102
-
103
-
104
-
105
-
106
-
107
-
108
-
109
-
110
-
111
-
112
-
113
-
114
-
115
-
116
 |
 |

PITNEY BOWES INC.
NOTES TO CONSOLIDATED FINANCIAL STATEMENTS
(Tabular dollars in thousands, except per share amounts)
70
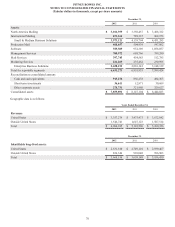
December 31,
2012 2011 2010
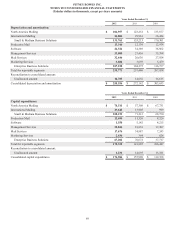
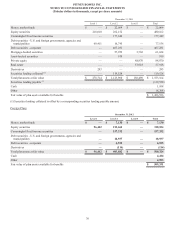
Assets:
North America Mailing $ 3,101,959 $ 3,350,457 $ 3,488,322
International Mailing 871,162 789,337 962,973
Small & Medium Business Solutions 3,973,121 4,139,794 4,451,295
Production Mail 408,657 504,939 547,002
Software 929,509 932,389 1,058,057
Management Services 700,972 688,766 799,290
Mail Services 397,745 454,585 512,785
Marketing Services 221,269 235,462 230,995
Enterprise Business Solutions 2,658,152 2,816,141 3,148,129
Total for reportable segments 6,631,273 6,955,935 7,599,424
Reconciliation to consolidated amount:
Cash and cash equivalents 913,276 856,238 484,363
Short-term investments 36,611 12,971 30,609
Other corporate assets 278,731 321,960 329,627
Consolidated assets $ 7,859,891 $ 8,147,104 $ 8,444,023
Geographic data is as follows:
Years Ended December 31,
2012 2011 2010
Revenues
United States $ 3,357,274 $ 3,475,473 $ 3,672,842
Outside United States 1,546,741 1,647,123 1,587,514
Total $ 4,904,015 $ 5,122,596 $ 5,260,356
December 31,
2012 2011 2010
Identifiable long-lived assets:
United States $ 2,831,810 $ 2,749,101 $ 2,939,467
Outside United States 836,346 910,048 996,963
Total $ 3,668,156 $ 3,659,149 $ 3,936,430