Pitney Bowes 2012 Annual Report Download - page 73
Download and view the complete annual report
Please find page 73 of the 2012 Pitney Bowes annual report below. You can navigate through the pages in the report by either clicking on the pages listed below, or by using the keyword search tool below to find specific information within the annual report.-
 1
1 -
2
-
3
-
4
-
5
-
6
-
7
-
8
-
9
-
10
-
11
-
12
-
13
-
14
-
15
-
16
-
17
-
18
-
19
-
20
-
21
-
22
-
23
-
24
-
25
-
26
-
27
-
28
-
29
-
30
-
31
-
32
-
33
-
34
-
35
-
36
-
37
-
38
-
39
-
40
-
41
-
42
-
43
-
44
-
45
-
46
-
47
-
48
-
49
-
50
-
51
-
52
-
53
-
54
-
55
-
56
-
57
-
58
-
59
-
60
-
61
-
62
-
 63
63 -
 64
64 -
 65
65 -
 66
66 -
 67
67 -
 68
68 -
 69
69 -
 70
70 -
 71
71 -
 72
72 -
 73
73 -
 74
74 -
 75
75 -
 76
76 -
 77
77 -
 78
78 -
 79
79 -
 80
80 -
 81
81 -
 82
82 -
 83
83 -
84
-
85
-
86
-
87
-
88
-
89
-
90
-
91
-
92
-
93
-
94
-
95
-
96
-
97
-
98
-
99
-
100
-
101
-
102
-
103
-
104
-
105
-
106
-
107
-
108
-
109
-
110
-
111
-
112
-
113
-
114
-
115
-
116
 |
 |

PITNEY BOWES INC.
NOTES TO CONSOLIDATED FINANCIAL STATEMENTS
(Tabular dollars in thousands, except per share amounts)
55
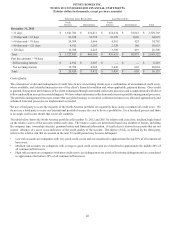
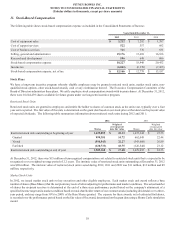
Deferred tax liabilities and assets consisted of the following:
December 31,
2012 2011
Deferred tax liabilities:
Depreciation $(65,205)$ (69,092)
Deferred profit (for tax purposes) on sale to finance subsidiary (157,279)(157,397)
Lease revenue and related depreciation (306,612)(422,541)
Amortizable intangibles (104,156)(99,980)
Other (35,157)(49,044)
Deferred tax liabilities (668,409)(798,054)
Deferred tax assets:
Nonpension postretirement benefits 119,002 198,379
Pension 117,509 40,956
Inventory and equipment capitalization 26,778 24,806
Restructuring charges 20,793 8,185
Long-term incentives 35,056 37,019
Net operating loss and tax credit carry forwards 194,134 180,281
Tax uncertainties gross-up 28,492 46,773
Other 89,406 99,996
Valuation allowance (142,176)(111,438)
Deferred tax assets 488,994 524,957
Total deferred taxes, net $(179,415)$ (273,097)
The above amounts are classified as current or long-term in the Consolidated Balance Sheets in accordance with the asset or liability to
which they related or based on the expected timing of the reversal. A valuation allowance was recognized to reduce the total deferred
tax assets to an amount that will more-likely-than-not be realized. The valuation allowance relates primarily to certain foreign, state and
local net operating loss and tax credit carryforwards that are more likely than not to expire unutilized.
We have net operating loss carry forwards of $339 million as of December 31, 2012. Most of these losses can be carried forward
indefinitely.
As of December 31, 2012 we have not provided for income taxes on $750 million of cumulative undistributed earnings of subsidiaries
outside the U.S. as these earnings will be either indefinitely reinvested or remitted substantially free of additional tax; however, we
estimate that withholding taxes on such remittances would be approximately $10 million. Determination of the liability that would be
incurred if these earnings were remitted to the U.S. is not practicable as there is a significant amount of uncertainty with respect to
determining the amount of foreign tax credits and other indirect tax consequences that may arise from the distribution of these earnings.