Pitney Bowes 2012 Annual Report Download - page 68
Download and view the complete annual report
Please find page 68 of the 2012 Pitney Bowes annual report below. You can navigate through the pages in the report by either clicking on the pages listed below, or by using the keyword search tool below to find specific information within the annual report.-
 1
1 -
2
-
3
-
4
-
5
-
6
-
7
-
8
-
9
-
10
-
11
-
12
-
13
-
14
-
15
-
16
-
17
-
18
-
19
-
20
-
21
-
22
-
23
-
24
-
25
-
26
-
27
-
28
-
29
-
30
-
31
-
32
-
33
-
34
-
35
-
36
-
37
-
38
-
39
-
40
-
41
-
42
-
43
-
44
-
45
-
46
-
47
-
48
-
49
-
50
-
51
-
52
-
53
-
54
-
55
-
56
-
57
-
 58
58 -
 59
59 -
 60
60 -
 61
61 -
 62
62 -
 63
63 -
 64
64 -
 65
65 -
 66
66 -
 67
67 -
 68
68 -
 69
69 -
 70
70 -
 71
71 -
 72
72 -
 73
73 -
 74
74 -
 75
75 -
 76
76 -
 77
77 -
 78
78 -
79
-
80
-
81
-
82
-
83
-
84
-
85
-
86
-
87
-
88
-
89
-
90
-
91
-
92
-
93
-
94
-
95
-
96
-
97
-
98
-
99
-
100
-
101
-
102
-
103
-
104
-
105
-
106
-
107
-
108
-
109
-
110
-
111
-
112
-
113
-
114
-
115
-
116
 |
 |
PITNEY BOWES INC.
NOTES TO CONSOLIDATED FINANCIAL STATEMENTS
(Tabular dollars in thousands, except per share amounts)
50
2011, the Bank had assets of $738 million and liabilities of $680 million. The Bank is regulated by the Federal Deposit Insurance
Corporation (FDIC) and the Utah Department of Financial Institutions.
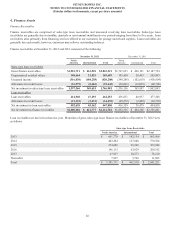
5. Intangible Assets and Goodwill
Intangible assets
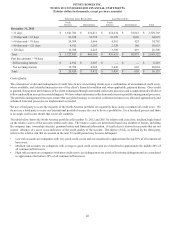
Intangible assets at December 31, 2012 and 2011 consisted of the following:
December 31, 2012 December 31, 2011
Gross
Carrying
Amount
Accumulated
Amortization
Net
Carrying
Amount
Gross
Carrying
Amount
Accumulated
Amortization
Net
Carrying
Amount
Customer relationships $ 407,901 $ (269,100) $ 138,801 $ 409,489 $ (237,536) $ 171,953
Supplier relationships 29,000 (22,113) 6,887 29,000 (19,213) 9,787
Software & technology 169,632 (151,628) 18,004 170,286 (143,456) 26,830
Trademarks & trade names 35,078 (32,615) 2,463 33,908 (30,076) 3,832
Non-compete agreements 7,471 (7,412)59
7,564 (7,363) 201
Total intangible assets $ 649,082 $ (482,868) $ 166,214 $ 650,247 $ (437,644) $ 212,603
Amortization expense for intangible assets was $45 million, $58 million and $61 million for the years ended December 31, 2012, 2011
and 2010, respectively. The future amortization expense for intangible assets as of December 31, 2012 was as follows:
Year ended December 31,
2013 $ 37,634
2014 36,944
2015 33,763
2016 25,412
2017 11,491
Thereafter 20,970
Total $ 166,214
Actual amortization expense may differ from the amounts above due to, among other things, fluctuations in foreign currency exchange
rates, impairments, future acquisitions and accelerated amortization.
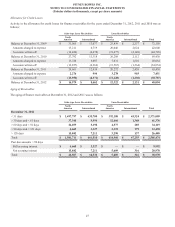
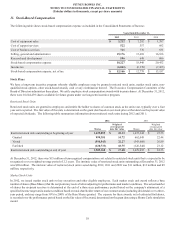
Goodwill
In 2011, based on the results of our annual goodwill impairment review, management determined that the international operations of our
Management Services segment (PBMSi) were impaired. The fair value of PBMSi was determined using a combination of techniques
including the present value of future cash flows, derived from our long-term plans and historical experience, multiples of competitors
and multiples from sales of like businesses. The inputs used to determine the fair value were classified as Level 3 in the fair value
hierarchy. Based on the results of our impairment test, we recorded a goodwill impairment charge of $84 million and an intangible asset
impairment charge of $5 million to write-down the carrying value of goodwill and intangible assets to their respective implied fair values.
The intangible asset impairment charge is included in restructuring changes and asset impairments in the Consolidated Statements of
Income.