Pitney Bowes 2012 Annual Report Download - page 36
Download and view the complete annual report
Please find page 36 of the 2012 Pitney Bowes annual report below. You can navigate through the pages in the report by either clicking on the pages listed below, or by using the keyword search tool below to find specific information within the annual report.-
 1
1 -
2
-
3
-
4
-
5
-
6
-
7
-
8
-
9
-
10
-
11
-
12
-
13
-
14
-
15
-
16
-
17
-
18
-
19
-
20
-
21
-
22
-
23
-
24
-
25
-
 26
26 -
 27
27 -
 28
28 -
 29
29 -
 30
30 -
 31
31 -
 32
32 -
 33
33 -
 34
34 -
 35
35 -
 36
36 -
 37
37 -
 38
38 -
 39
39 -
 40
40 -
 41
41 -
 42
42 -
 43
43 -
 44
44 -
 45
45 -
 46
46 -
47
-
48
-
49
-
50
-
51
-
52
-
53
-
54
-
55
-
56
-
57
-
58
-
59
-
60
-
61
-
62
-
63
-
64
-
65
-
66
-
67
-
68
-
69
-
70
-
71
-
72
-
73
-
74
-
75
-
76
-
77
-
78
-
79
-
80
-
81
-
82
-
83
-
84
-
85
-
86
-
87
-
88
-
89
-
90
-
91
-
92
-
93
-
94
-
95
-
96
-
97
-
98
-
99
-
100
-
101
-
102
-
103
-
104
-
105
-
106
-
107
-
108
-
109
-
110
-
111
-
112
-
113
-
114
-
115
-
116
 |
 |

18
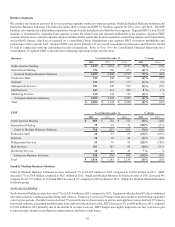
Management Services
Management Services revenue decreased 3% in 2012 to $921 million compared to $949 million in 2011 and EBIT decreased 28% to $55
million compared to $76 million in 2011. The decline in revenue and EBIT was primarily due to lower document volumes, account
contractions and reduced pricing on new business and contract renewals. Foreign currency translation had an unfavorable impact on
revenue of 1%.
Management Services revenue in 2011 decreased 5% to $949 million compared to $999 million in 2010. Foreign currency translation
had a positive impact of 1% on revenue. EBIT decreased 18% to $76 million compared to $93 million in 2010. The decrease in revenue
and EBIT was primarily due to the full year impact of account contractions and terminations in the U.S. during 2010 and pricing pressure
on new business and contract renewals.
Mail Services
Mail Services revenue increased 8% to $445 million in 2012 compared to $412 million in 2011; however, 5% of the increase was due to
lost revenue of $20 million in 2011 caused by the February 2011 fire at our Dallas presort facility. The remaining increase of 3% was
primarily due to higher standard mail volumes processed in our Presort business. EBIT decreased 2% to $101 million in 2012 compared
to $103 million in 2011. EBIT in 2012 includes a benefit of $11 million from insurance recoveries while EBIT in 2011 includes a benefit
of $27 million from insurance recoveries, partially offset by the adverse impact of $20 million from lost revenues (net benefit of $7
million). Excluding the fire-related benefits, underlying EBIT decreased 6% primarily due to start-up costs related to our partnership
with eBay to provide cross-border ecommerce solutions.
Mail Services revenue increased 1% to $412 million in 2011 compared to $408 million in 2010 and EBIT increased 22% to $103 million
compared to $85 million in 2010. However, taking into account the lost revenue of $20 million and EBIT benefit of $7 million in 2011,
revenue and EBIT increased 6% and 14%, respectively. The increase in revenue and EBIT was primarily due to the full year impact of
a 2010 acquisition, higher standard mail volumes processed in our Presort business and lower costs from productivity initiatives.
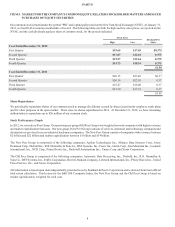
Marketing Services
Marketing Services revenue decreased 3% to $138 million compared to $142 million in 2011 in part due to a decline in household moves
but EBIT increased 7% to $28 million compared to $26 million in 2011 due to lower print production costs and administrative costs. We
expect segment revenue in 2013 to decline 10-15% and EBIT to decline by about a third due to lower fees for certain renegotiated
contracts. Marketing Services revenue and EBIT for 2011 were flat compared to 2010.
LIQUIDITY AND CAPITAL RESOURCES
We believe that cash generated from operations, existing cash and investments and borrowing capacity under our commercial paper
program are currently sufficient to support our cash needs, including items like business operations, debt repayments and customer
deposits as well as discretionary uses such as capital investments, dividends and share repurchases. Cash and cash equivalents and short-
term investments were $950 million at December 31, 2012 and $869 million at December 31, 2011.
We have had the ability to supplement short-term liquidity through our consistent and uninterrupted access to the commercial paper
market to date. We have the ability to fund the long-term needs of our business through broad access to capital markets, cash flow,
proceeds from divestitures, a credit line facility and our effective shelf registration statement.
During the year, the rating agencies reduced our credit ratings. There can be no assurances that one or more of the rating agencies will
not take additional adverse actions in the future.
We continuously review our liquidity profile through published credit ratings and the credit default swap market. We also monitor the
creditworthiness of those banks acting as derivative counterparties, depository banks or credit providers.
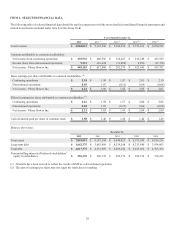
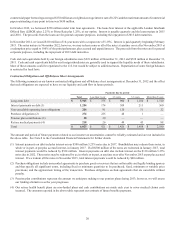
Cash Flow Summary
During the fourth quarter of 2012, we determined that, beginning with the three month period ended December 31, 2011 and each
subsequent three month period through September 30, 2012, changes in certain investment-related working capital accounts that were
classified in the Consolidated Statement of Cash Flows as cash flows from operating activities should have been classified as cash flows
from investing activities. The cash flow amounts in the table below for the year ended December 31, 2011 have been revised to reflect
the correct classification of cash flows, resulting in an increase in cash provided by operating activities and an increase in cash used in
investing activities of $29 million.