Pitney Bowes 2012 Annual Report Download - page 16
Download and view the complete annual report
Please find page 16 of the 2012 Pitney Bowes annual report below. You can navigate through the pages in the report by either clicking on the pages listed below, or by using the keyword search tool below to find specific information within the annual report.-
 1
1 -
2
-
3
-
4
-
5
-
 6
6 -
 7
7 -
 8
8 -
 9
9 -
 10
10 -
 11
11 -
 12
12 -
 13
13 -
 14
14 -
 15
15 -
 16
16 -
 17
17 -
 18
18 -
 19
19 -
 20
20 -
 21
21 -
 22
22 -
 23
23 -
 24
24 -
 25
25 -
 26
26 -
27
-
28
-
29
-
30
-
31
-
32
-
33
-
34
-
35
-
36
-
37
-
38
-
39
-
40
-
41
-
42
-
43
-
44
-
45
-
46
-
47
-
48
-
49
-
50
-
51
-
52
-
53
-
54
-
55
-
56
-
57
-
58
-
59
-
60
-
61
-
62
-
63
-
64
-
65
-
66
-
67
-
68
-
69
-
70
-
71
-
72
-
73
-
74
-
75
-
76
-
77
-
78
-
79
-
80
-
81
-
82
-
83
-
84
-
85
-
86
-
87
-
88
-
89
-
90
-
91
-
92
-
93
-
94
-
95
-
96
-
97
-
98
-
99
-
100
-
101
-
102
-
103
-
104
-
105
-
106
-
107
-
108
-
109
-
110
-
111
-
112
-
113
-
114
-
115
-
116
 |
 |

Pitney Bowes Annual Report 201214
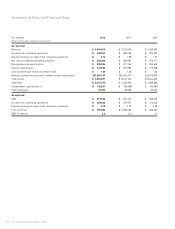
Summary of Selected Financial Data
For the year 2012 2011 2010
(Dollars in thousands, except per share amounts)
As reported
Revenue $ 4,904,015 $ 5,122,596 $ 5,260,356
Income from continuing operations $ 435,932 $ 400,556 $ 324,267
Diluted earnings per share from continuing operations $ 2.16 $ 1.98 $ 1.57
Net cash provided by operating activities $ 660,188 $ 948,987 $ 952,111
Depreciation and amortization $ 255,556 $ 272,142 $ 303,653
Capital expenditures $ 176,586 $ 155,980 $ 119,768
Cash dividends per share of common stock $ 1.50 $ 1.48 $ 1.46
Average common and potential common shares outstanding 201,366,139 202,765,947 206,752,872
Total assets $ 7,859,891 $ 8,147,104 $ 8,444,023
Total debt $ 4,017,375 $ 4,233,909 $ 4,289,248
Stockholders’ equity (deficit) $ 110,631 $ (38,986) $ (96,581)
Total employees 27,353 28,683 30,661
As adjusted
EBIT $ 819,932 $ 912,137 $ 939,474
Income from continuing operations $ 438,453 $ 557,957 $ 474,442
Diluted earnings per share from continuing operations $ 2.18 $ 2.75 $ 2.29
Free cash flow $ 769,084 $ 1,058,363 $ 962,307
EBIT to interest 4.4 4.6 4.7