Pitney Bowes 2012 Annual Report Download - page 64
Download and view the complete annual report
Please find page 64 of the 2012 Pitney Bowes annual report below. You can navigate through the pages in the report by either clicking on the pages listed below, or by using the keyword search tool below to find specific information within the annual report.-
 1
1 -
2
-
3
-
4
-
5
-
6
-
7
-
8
-
9
-
10
-
11
-
12
-
13
-
14
-
15
-
16
-
17
-
18
-
19
-
20
-
21
-
22
-
23
-
24
-
25
-
26
-
27
-
28
-
29
-
30
-
31
-
32
-
33
-
34
-
35
-
36
-
37
-
38
-
39
-
40
-
41
-
42
-
43
-
44
-
45
-
46
-
47
-
48
-
49
-
50
-
51
-
52
-
53
-
 54
54 -
 55
55 -
 56
56 -
 57
57 -
 58
58 -
 59
59 -
 60
60 -
 61
61 -
 62
62 -
 63
63 -
 64
64 -
 65
65 -
 66
66 -
 67
67 -
 68
68 -
 69
69 -
 70
70 -
 71
71 -
 72
72 -
 73
73 -
 74
74 -
75
-
76
-
77
-
78
-
79
-
80
-
81
-
82
-
83
-
84
-
85
-
86
-
87
-
88
-
89
-
90
-
91
-
92
-
93
-
94
-
95
-
96
-
97
-
98
-
99
-
100
-
101
-
102
-
103
-
104
-
105
-
106
-
107
-
108
-
109
-
110
-
111
-
112
-
113
-
114
-
115
-
116
 |
 |

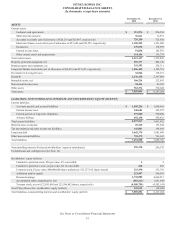
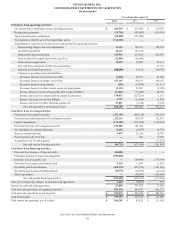
PITNEY BOWES INC.
NOTES TO CONSOLIDATED FINANCIAL STATEMENTS
(Tabular dollars in thousands, except per share amounts)
46
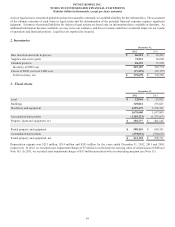
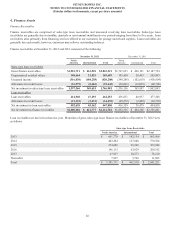
4. Finance Assets
Finance Receivables
Finance receivables are comprised of sales-type lease receivables and unsecured revolving loan receivables. Sales-type lease
receivables are generally due in monthly, quarterly or semi-annual installments over periods ranging from three to five years. Loan
receivables arise primarily from financing services offered to our customers for postage and related supplies. Loan receivables are
generally due each month; however, customers may rollover outstanding balances.
Finance receivables at December 31, 2012 and 2011 consisted of the following:
December 31, 2012 December 31, 2011
North
America International Total
North
America International Total
Sales-type lease receivables
Gross finance receivables $1,581,711 $ 461,510 $2,043,221 $1,727,653 $ 460,101 $2,187,754
Unguaranteed residual values 148,664 21,025 169,689 185,450 20,443 205,893
Unearned income (316,030) (104,258)(420,288)(348,286)(102,618) (450,904)
Allowance for credit losses (16,979) (8,662)(25,641)(28,661)(12,039) (40,700)
Net investment in sales-type lease receivables 1,397,366 369,615 1,766,981 1,536,156 365,887 1,902,043
Loan receivables
Loan receivables 414,960 47,293 462,253 436,631 40,937 477,568
Allowance for credit losses (12,322) (2,131)(14,453)(20,272)(2,458) (22,730)
Net investment in loan receivables 402,638 45,162 447,800 416,359 38,479 454,838
Net investment in finance receivables $1,800,004 $ 414,777 $2,214,781 $1,952,515 $ 404,366 $2,356,881
Loan receivables are due in less than one year. Maturities of gross sales-type lease finance receivables at December 31, 2012 were
as follows:
Sales-type Lease Receivables
North America International Total
2013 $ 661,770 $ 142,134 $ 803,904
2014 443,284 127,040 570,324
2015 274,680 95,268 369,948
2016 146,113 63,029 209,142
2017 47,937 30,273 78,210
Thereafter 7,927 3,766 11,693
Total $ 1,581,711 $ 461,510 $ 2,043,221