Pitney Bowes 2012 Annual Report Download - page 103
Download and view the complete annual report
Please find page 103 of the 2012 Pitney Bowes annual report below. You can navigate through the pages in the report by either clicking on the pages listed below, or by using the keyword search tool below to find specific information within the annual report.-
 1
1 -
2
-
3
-
4
-
5
-
6
-
7
-
8
-
9
-
10
-
11
-
12
-
13
-
14
-
15
-
16
-
17
-
18
-
19
-
20
-
21
-
22
-
23
-
24
-
25
-
26
-
27
-
28
-
29
-
30
-
31
-
32
-
33
-
34
-
35
-
36
-
37
-
38
-
39
-
40
-
41
-
42
-
43
-
44
-
45
-
46
-
47
-
48
-
49
-
50
-
51
-
52
-
53
-
54
-
55
-
56
-
57
-
58
-
59
-
60
-
61
-
62
-
63
-
64
-
65
-
66
-
67
-
68
-
69
-
70
-
71
-
72
-
73
-
74
-
75
-
76
-
77
-
78
-
79
-
80
-
81
-
82
-
83
-
84
-
85
-
86
-
87
-
88
-
89
-
90
-
91
-
92
-
 93
93 -
 94
94 -
 95
95 -
 96
96 -
 97
97 -
 98
98 -
 99
99 -
 100
100 -
 101
101 -
 102
102 -
 103
103 -
 104
104 -
 105
105 -
 106
106 -
 107
107 -
 108
108 -
 109
109 -
 110
110 -
 111
111 -
 112
112 -
 113
113 -
114
-
115
-
116
 |
 |

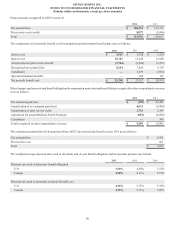
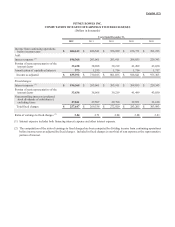
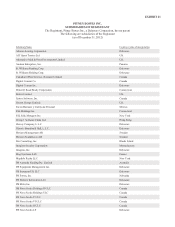
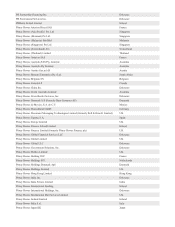
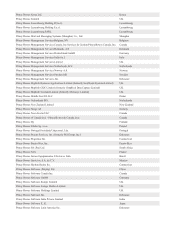
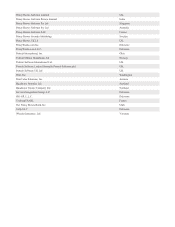
PITNEY BOWES INC.
NOTES TO CONSOLIDATED FINANCIAL STATEMENTS
(Tabular dollars in thousands, except per share amounts)
85
First
Quarter
Second
Quarter
Third
Quarter
Fourth
Quarter Total
2011
Revenue $ 1,279,184 $ 1,275,500 $ 1,262,757 $ 1,305,155 $ 5,122,596
Cost and expenses 1,139,147 1,112,937 1,101,815 1,282,156 4,636,055
Income from continuing operations 140,037 162,563 160,942 22,999 486,541
Provision (benefit) for income taxes 43,552 54,190 2,038 (32,170) 67,610
Income from continuing operations 96,485 108,373 158,904 55,169 418,931
(Loss) gain from discontinued operations (5,588) (2,844) 18,457 206,899 216,924
Net income before attribution of noncontrolling interests 90,897 105,529 177,361 262,068 635,855
Less: Preferred stock dividends of subsidiaries attributable to
noncontrolling interests 4,594 4,594 4,593 4,594 18,375
Net income - Pitney Bowes Inc. $ 86,303 $ 100,935 $ 172,768 $ 257,474 $ 617,480
Amounts attributable to common stockholders:
Income from continuing operations $ 91,891 $ 103,779 $ 154,311 $ 50,575 $ 400,556
(Loss) gain from discontinued operations (5,588) (2,844) 18,457 206,899 216,924
Net income - Pitney Bowes Inc. $ 86,303 $ 100,935 $ 172,768 $ 257,474 $ 617,480
Basic earnings per share attributable to common stockholders:
Continuing operations $ 0.45 $ 0.51 $ 0.77 $ 0.25 $ 1.98
Discontinued operations (0.03) (0.01) 0.09 1.04 1.07
Net income - Pitney Bowes Inc. $ 0.42 $ 0.50 $ 0.86 $ 1.29 $ 3.06
Diluted earnings per share attributable to common stockholders:
Continuing operations $ 0.45 $ 0.51 $ 0.76 $ 0.25 $ 1.98
Discontinued operations (0.03) (0.01) 0.09 1.03 1.07
Net income - Pitney Bowes Inc. $ 0.42 $ 0.49 $ 0.85 $ 1.28 $ 3.05
As discussed in Note 1, we have revised each of our statements of cash flows by reducing operating cash flows and increasing investing
cash flows for the year-to-date periods ended March, June and September 2012 by $25 million, $30 million and $35 million, respectively.
We have determined that these adjustments are not material to our consolidated financial statements for any of the affected periods.
However, we will reflect these revisions in future Form 10-Q filings as appropriate.