Pitney Bowes 2012 Annual Report Download - page 53
Download and view the complete annual report
Please find page 53 of the 2012 Pitney Bowes annual report below. You can navigate through the pages in the report by either clicking on the pages listed below, or by using the keyword search tool below to find specific information within the annual report.-
 1
1 -
2
-
3
-
4
-
5
-
6
-
7
-
8
-
9
-
10
-
11
-
12
-
13
-
14
-
15
-
16
-
17
-
18
-
19
-
20
-
21
-
22
-
23
-
24
-
25
-
26
-
27
-
28
-
29
-
30
-
31
-
32
-
33
-
34
-
35
-
36
-
37
-
38
-
39
-
40
-
41
-
42
-
 43
43 -
 44
44 -
 45
45 -
 46
46 -
 47
47 -
 48
48 -
 49
49 -
 50
50 -
 51
51 -
 52
52 -
 53
53 -
 54
54 -
 55
55 -
 56
56 -
 57
57 -
 58
58 -
 59
59 -
 60
60 -
 61
61 -
 62
62 -
 63
63 -
64
-
65
-
66
-
67
-
68
-
69
-
70
-
71
-
72
-
73
-
74
-
75
-
76
-
77
-
78
-
79
-
80
-
81
-
82
-
83
-
84
-
85
-
86
-
87
-
88
-
89
-
90
-
91
-
92
-
93
-
94
-
95
-
96
-
97
-
98
-
99
-
100
-
101
-
102
-
103
-
104
-
105
-
106
-
107
-
108
-
109
-
110
-
111
-
112
-
113
-
114
-
115
-
116
 |
 |

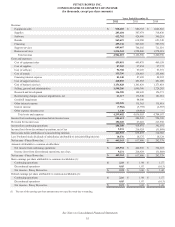
PITNEY BOWES INC.
CONSOLIDATED STATEMENTS OF INCOME
(In thousands, except per share amounts)
35
Years Ended December 31,
2012 2011 2010
Revenue:
Equipment sales $ 938,289 $ 986,392 $ 1,022,563
Supplies 283,604 307,974 318,430
Software 412,762 426,606 390,219
Rentals 569,619 618,990 651,348
Financing 495,130 547,269 587,359
Support services 689,667 706,505 711,519
Business services 1,514,944 1,528,860 1,578,918
Total revenue 4,904,015 5,122,596 5,260,356
Costs and expenses:
Cost of equipment sales 459,051 449,479 469,158
Cost of supplies 87,569 97,454 97,172
Cost of software 92,708 99,107 93,391
Cost of rentals 115,356 138,603 155,480
Financing interest expense 81,140 87,698 88,292
Cost of support services 440,055 452,582 451,609
Cost of business services 1,156,828 1,161,429 1,173,418
Selling, general and administrative 1,598,286 1,690,360 1,724,283
Research and development 136,908 148,645 156,371
Restructuring charges and asset impairments, net 23,117 136,548 181,961
Goodwill impairment —84,500 —
Other interest expense 115,228 115,363 115,619
Interest income (7,982) (5,795) (2,587)
Other expense (income), net 1,138 (19,918) —
Total costs and expenses 4,299,402 4,636,055 4,704,167
Income from continuing operations before income taxes 604,613 486,541 556,189
Provision for income taxes 150,305 67,610 213,598
Income from continuing operations 454,308 418,931 342,591
Income (loss) from discontinued operations, net of tax 9,231 216,924 (31,888)
Net income before attribution of noncontrolling interests 463,539 635,855 310,703
Less: Preferred stock dividends of subsidiaries attributable to noncontrolling interests 18,376 18,375 18,324
Net income - Pitney Bowes Inc. $ 445,163 $ 617,480 $ 292,379
Amounts attributable to common stockholders:
Net income from continuing operations $ 435,932 $ 400,556 $ 324,267
Income (loss) from discontinued operations, net of tax 9,231 216,924 (31,888)
Net income - Pitney Bowes Inc. $ 445,163 $ 617,480 $ 292,379
Basic earnings per share attributable to common stockholders (1):
Continuing operations $ 2.18 $ 1.98 $ 1.57
Discontinued operations 0.05 1.07 (0.15)
Net income - Pitney Bowes Inc. $ 2.22 $ 3.06 $ 1.42
Diluted earnings per share attributable to common stockholders (1):
Continuing operations $ 2.16 $ 1.98 $ 1.57
Discontinued operations 0.05 1.07 (0.15)
Net income - Pitney Bowes Inc. $ 2.21 $ 3.05 $ 1.41
(1) The sum of the earnings per share amounts may not equal the totals due to rounding.
See Notes to Consolidated Financial Statements