Pitney Bowes 2012 Annual Report Download - page 37
Download and view the complete annual report
Please find page 37 of the 2012 Pitney Bowes annual report below. You can navigate through the pages in the report by either clicking on the pages listed below, or by using the keyword search tool below to find specific information within the annual report.-
 1
1 -
2
-
3
-
4
-
5
-
6
-
7
-
8
-
9
-
10
-
11
-
12
-
13
-
14
-
15
-
16
-
17
-
18
-
19
-
20
-
21
-
22
-
23
-
24
-
25
-
26
-
 27
27 -
 28
28 -
 29
29 -
 30
30 -
 31
31 -
 32
32 -
 33
33 -
 34
34 -
 35
35 -
 36
36 -
 37
37 -
 38
38 -
 39
39 -
 40
40 -
 41
41 -
 42
42 -
 43
43 -
 44
44 -
 45
45 -
 46
46 -
 47
47 -
48
-
49
-
50
-
51
-
52
-
53
-
54
-
55
-
56
-
57
-
58
-
59
-
60
-
61
-
62
-
63
-
64
-
65
-
66
-
67
-
68
-
69
-
70
-
71
-
72
-
73
-
74
-
75
-
76
-
77
-
78
-
79
-
80
-
81
-
82
-
83
-
84
-
85
-
86
-
87
-
88
-
89
-
90
-
91
-
92
-
93
-
94
-
95
-
96
-
97
-
98
-
99
-
100
-
101
-
102
-
103
-
104
-
105
-
106
-
107
-
108
-
109
-
110
-
111
-
112
-
113
-
114
-
115
-
116
 |
 |

19
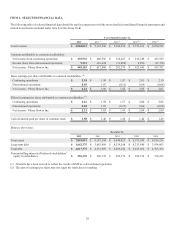
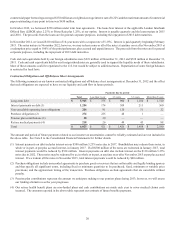
The change in cash and cash equivalents is as follows:
Year Ended December 31, Change
2012 2011 2010 2012 2011
Net cash provided by operating activities $ 660 $ 949 $ 952 $(289)$(3)
Net cash used in investing activities (87)(117)(301)30 184
Net cash used in financing activities (520)(455)(580)(65)125
Effect of exchange rate changes on cash and cash equivalents 3(5)1 8(6)
Change in cash and cash equivalents $57
$ 372 $ 72 $(316)$ 300
Net cash provided by operating activities was $660 million in 2012 compared to $949 million in 2011. The decrease in cash provided
by operations was primarily due to higher tax payments in 2012 resulting from the sale of leveraged lease assets, the loss of bonus
depreciation and higher income tax refunds received in 2011. The cash impact of finance and accounts receivables were also $105 million
lower in 2012 compared to 2011.
Net cash provided by operating activities of $949 million in 2011 was relatively unchanged from cash provided by operating activities
of $952 million in 2010. Cash flow in 2011 benefited from lower tax payments of $187 million and higher net collections of finance and
accounts receivables of $26 million but these benefits were offset by a special pension plan contribution of $123 million and higher
payments of accounts payable and accrued liabilities of $42 million. Cash flow in 2010 benefited from proceeds of $32 million received
from the unwinding of interest rate swaps. The decrease in current and non-current income taxes of $258 million in 2011 includes the
tax benefits recognized in connection with the 2001-2008 IRS tax settlements.
Net cash used in investing activities was $87 million in 2012 and $117 million in 2011. The improvement in cash used in 2012 was due
to lower net purchases of investment securities partially offset by higher capital expenditures and lower growth in customer deposits.
Net cash used in investing activities was $117 million in 2011 compared to $301 million in 2010. The decrease in cash used was primarily
due to proceeds of $102 million from the sale of leveraged lease assets, lower net purchases of investment securities of $26 million and
acquisitions of $78 million in 2010. These improvements were partially offset by higher capital expenditures of $36 million.
Net cash used in financing activities was $520 million in 2012 compared to $455 million in 2011. The increase in cash used was due to
higher debt reduction partially offset by lower share repurchases. During the year, $550 million of debt matured and was repaid and we
issued $340 million of new debt. In 2011, the reduction in debt was $50 million. During 2012, we did not repurchase any shares of our
common stock compared to $100 million of share repurchases in 2011.
Net cash used in financing activities was $455 million in 2011 compared to $580 million in 2010. The decrease in cash used was primarily
due to lower repayments of notes payable due to an overall decline in commercial paper borrowings in 2011 compared to 2010.
Dividends
We paid dividends to our common stockholders of $301 million ($1.50 per share), $300 million ($1.48 per share) and $301 million ($1.46
per share) in 2012, 2011 and 2010, respectively.
Going forward, each quarter our Board of Directors will continue to consider our recent and projected earnings and other capital needs
and priorities in deciding whether to approve the amount and payment of a dividend.
On January 31, 2013, our Board of Directors declared a cash dividend of $0.375 cent per share for the first quarter of 2013. There are
no material restrictions on our ability to declare dividends.
Financings and Capitalization
We are a Well-Known Seasoned Issuer with the SEC, which allows us to issue debt securities, preferred stock, preference stock, common
stock, purchase contracts, depositary shares, warrants and units in an expedited fashion. We have a commercial paper program that is an
important source of liquidity for us and a committed credit facility of $1.0 billion to support our commercial paper issuances. The credit
facility expires in April 2016. We have not drawn upon the credit facility.
At December 31, 2012, there were no outstanding commercial paper borrowings. During the year, commercial paper borrowings averaged
$221 million at a weighted-average interest rate of 0.39% and the maximum amount outstanding at any time was $709 million. In 2011,