Pitney Bowes 2012 Annual Report Download - page 78
Download and view the complete annual report
Please find page 78 of the 2012 Pitney Bowes annual report below. You can navigate through the pages in the report by either clicking on the pages listed below, or by using the keyword search tool below to find specific information within the annual report.-
 1
1 -
2
-
3
-
4
-
5
-
6
-
7
-
8
-
9
-
10
-
11
-
12
-
13
-
14
-
15
-
16
-
17
-
18
-
19
-
20
-
21
-
22
-
23
-
24
-
25
-
26
-
27
-
28
-
29
-
30
-
31
-
32
-
33
-
34
-
35
-
36
-
37
-
38
-
39
-
40
-
41
-
42
-
43
-
44
-
45
-
46
-
47
-
48
-
49
-
50
-
51
-
52
-
53
-
54
-
55
-
56
-
57
-
58
-
59
-
60
-
61
-
62
-
63
-
64
-
65
-
66
-
67
-
 68
68 -
 69
69 -
 70
70 -
 71
71 -
 72
72 -
 73
73 -
 74
74 -
 75
75 -
 76
76 -
 77
77 -
 78
78 -
 79
79 -
 80
80 -
 81
81 -
 82
82 -
 83
83 -
 84
84 -
 85
85 -
 86
86 -
 87
87 -
 88
88 -
89
-
90
-
91
-
92
-
93
-
94
-
95
-
96
-
97
-
98
-
99
-
100
-
101
-
102
-
103
-
104
-
105
-
106
-
107
-
108
-
109
-
110
-
111
-
112
-
113
-
114
-
115
-
116
 |
 |

PITNEY BOWES INC.
NOTES TO CONSOLIDATED FINANCIAL STATEMENTS
(Tabular dollars in thousands, except per share amounts)
60
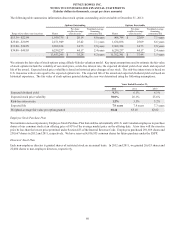
The following table summarizes information about stock options outstanding and exercisable at December 31, 2012:
Options Outstanding Options Exercisable
Range of per share exercise prices Shares
Per share
weighted-average
exercise price
Weighted-average
remaining
contractual life Shares
Per share
weighted-average
exercise price
Weighted-average
remaining
contractual life
$13.39 - $22.99 1,959,735 $ 20.14 8.0 years 906,744 $ 22.09 7.1 years
$23.00 - $30.99 2,471,949 25.42 7.1 years 1,634,036 25.09 6.6 years
$31.00 - $38.99 2,962,324 34.73 2.8 years 2,962,324 34.73 2.8 years
$39.00 - $48.03 6,259,237 44.17 2.4 years 6,259,237 44.17 2.4 years
13,653,245 $ 35.28 4.2 years 11,762,341 $ 37.44 3.5 years
We estimate the fair value of stock options using a Black-Scholes valuation model. Key input assumptions used to estimate the fair value
of stock options include the volatility of our stock price, a risk-free interest rate, the expected dividend yield of our stock and expected
life of the award. Expected stock price volatility is based on historical price changes of our stock. The risk-free interest rate is based on
U.S. treasuries with a term equal to the expected option term. The expected life of the award and expected dividend yield are based on
historical experience. The fair value of stock options granted during the year was determined using the following assumptions:
Years Ended December 31,
2012 2011 2010
Expected dividend yield 9.3% 6.1% 6.1%
Expected stock price volatility 30.0% 26.1% 25.6%
Risk-free interest rate 1.2% 3.3% 3.2%
Expected life 7.9 years 7.4 years 7.3 years
Weighted-average fair value per option granted $0.48 $3.45 $2.82
Employee Stock Purchase Plan
We maintain a non-compensatory Employee Stock Purchase Plan that enables substantially all U.S. and Canadian employees to purchase
shares of our common stock at an offering price of 95% of the average market price on the offering date. At no time will the exercise
price be less than the lowest price permitted under Section 423 of the Internal Revenue Code. Employees purchased 291,859 shares and
258,667 shares in 2012 and 2011, respectively. We have reserved 4,816,935 common shares for future purchase under the ESPP.
Directors' Stock Plan
Each non-employee director is granted shares of restricted stock on an annual basis. In 2012 and 2011, we granted 26,653 shares and
22,000 shares to non-employee directors, respectively.