Pitney Bowes 2012 Annual Report Download - page 27
Download and view the complete annual report
Please find page 27 of the 2012 Pitney Bowes annual report below. You can navigate through the pages in the report by either clicking on the pages listed below, or by using the keyword search tool below to find specific information within the annual report.-
 1
1 -
2
-
3
-
4
-
5
-
6
-
7
-
8
-
9
-
10
-
11
-
12
-
13
-
14
-
15
-
16
-
 17
17 -
 18
18 -
 19
19 -
 20
20 -
 21
21 -
 22
22 -
 23
23 -
 24
24 -
 25
25 -
 26
26 -
 27
27 -
 28
28 -
 29
29 -
 30
30 -
 31
31 -
 32
32 -
 33
33 -
 34
34 -
 35
35 -
 36
36 -
 37
37 -
38
-
39
-
40
-
41
-
42
-
43
-
44
-
45
-
46
-
47
-
48
-
49
-
50
-
51
-
52
-
53
-
54
-
55
-
56
-
57
-
58
-
59
-
60
-
61
-
62
-
63
-
64
-
65
-
66
-
67
-
68
-
69
-
70
-
71
-
72
-
73
-
74
-
75
-
76
-
77
-
78
-
79
-
80
-
81
-
82
-
83
-
84
-
85
-
86
-
87
-
88
-
89
-
90
-
91
-
92
-
93
-
94
-
95
-
96
-
97
-
98
-
99
-
100
-
101
-
102
-
103
-
104
-
105
-
106
-
107
-
108
-
109
-
110
-
111
-
112
-
113
-
114
-
115
-
116
 |
 |

9
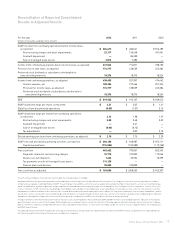
The accompanying graph compares the most recent five-year share performance of Pitney Bowes, the Standard and Poor's (S&P) 500
Composite Index, the New Peer Group and the Old Peer Group and shows that on a total return basis, assuming reinvestment of all
dividends, $100 invested in the company's common stock, the S&P 500 Composite Index, the New Peer Group and the Old Peer
Group on December 31, 2007 would have been worth $40, $109, $90 and $74, respectively, on December 31, 2012.
Indexed Returns December 31,
Company Name / Index 2007 2008 2009 2010 2011 2012
Pitney Bowes $100 $70 $67 $76 $62 $40
S&P 500 $100 $63 $80 $92 $94 $109
New Peer Group $100 $56 $72 $86 $79 $90
Old Peer Group $100 $74 $93 $95 $81 $74