Pitney Bowes 2012 Annual Report Download - page 30
Download and view the complete annual report
Please find page 30 of the 2012 Pitney Bowes annual report below. You can navigate through the pages in the report by either clicking on the pages listed below, or by using the keyword search tool below to find specific information within the annual report.-
 1
1 -
2
-
3
-
4
-
5
-
6
-
7
-
8
-
9
-
10
-
11
-
12
-
13
-
14
-
15
-
16
-
17
-
18
-
19
-
 20
20 -
 21
21 -
 22
22 -
 23
23 -
 24
24 -
 25
25 -
 26
26 -
 27
27 -
 28
28 -
 29
29 -
 30
30 -
 31
31 -
 32
32 -
 33
33 -
 34
34 -
 35
35 -
 36
36 -
 37
37 -
 38
38 -
 39
39 -
 40
40 -
41
-
42
-
43
-
44
-
45
-
46
-
47
-
48
-
49
-
50
-
51
-
52
-
53
-
54
-
55
-
56
-
57
-
58
-
59
-
60
-
61
-
62
-
63
-
64
-
65
-
66
-
67
-
68
-
69
-
70
-
71
-
72
-
73
-
74
-
75
-
76
-
77
-
78
-
79
-
80
-
81
-
82
-
83
-
84
-
85
-
86
-
87
-
88
-
89
-
90
-
91
-
92
-
93
-
94
-
95
-
96
-
97
-
98
-
99
-
100
-
101
-
102
-
103
-
104
-
105
-
106
-
107
-
108
-
109
-
110
-
111
-
112
-
113
-
114
-
115
-
116
 |
 |

12
of mail and catalogs. During the year, we recorded goodwill and asset impairment charges of $35 million to write down the net assets
of IMS to their estimated fair value less costs to sell. These charges and the operating results of IMS for all periods presented have been
classified as discontinued operations.
For the year, cash flow from operations declined to $660 million compared to $949 million in 2011. Lower cash flow in 2012 was
primarily due to higher tax payments and a lower cash impact from net collections of finance and accounts receivables. Also in 2012,
we received $106 million from the sale of leveraged lease assets and $340 million from the issuance of new debt, while uses of cash
included $550 million to redeem maturing debt, $319 million to pay dividends and $177 million to fund capital investments. At
December 31, 2012, cash and cash equivalents and short-term investments were $950 million.
Outlook
Worldwide economic conditions continue to create a challenging business environment causing many of our clients to remain cautious
about spending and therefore impact the performance of our business segments. Our growth initiatives continue to focus on leveraging
our expertise in physical communications with our expanding capabilities in digital and hybrid communications and developing products,
software, services and solutions that help our clients grow their businesses by more effectively communicating with their customers. We
expect to make continued investments in these growth initiatives during the first half of 2013, which are expected to lead to greater
revenue and margin contribution in the second half of 2013.
We expect revenue growth in certain of our Enterprise Business Solutions segments in 2013 from our ecommerce, print outsourcing and
software solutions. We expect our mix of business will continue to shift to more enterprise related products and solutions and that these
new revenue streams will have lower margins than our traditional Mailing business.
Small and Medium Business Solutions revenues will continue to be challenged by the decline in physical mail volumes. However, in
2013, we expect revenue will benefit from an improvement in equipment sales trends, due in part to global sales of our Connect+TM
communications systems and SendSuite LiveTM shipping solutions, and that this improvement will lead to a moderation in the decline
of rentals, financing and supplies revenue in the second half of 2013.
RESULTS OF OPERATIONS
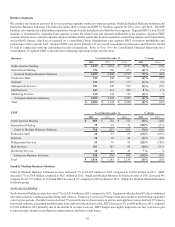
Revenue by source and the related cost of revenue are shown in the following tables:
Revenue
Year Ended December 31, % change
2012 2011 2010 2012 2011
Equipment sales $ 938 $ 986 $ 1,023 (5)% (4)%
Supplies 284 308 318 (8)% (3)%
Software 413 427 390 (3)% 9%
Rentals 570 619 651 (8)% (5)%
Financing 495 547 587 (10)% (7)%
Support services 690 707 712 (2)% (1)%
Business services 1,515 1,529 1,579 (1)% (3)%
Total revenue $ 4,904 $ 5,123 $ 5,260 (4)% (3)%