Pitney Bowes 2012 Annual Report Download - page 76
Download and view the complete annual report
Please find page 76 of the 2012 Pitney Bowes annual report below. You can navigate through the pages in the report by either clicking on the pages listed below, or by using the keyword search tool below to find specific information within the annual report.
PITNEY BOWES INC.
NOTES TO CONSOLIDATED FINANCIAL STATEMENTS
(Tabular dollars in thousands, except per share amounts)
58
11. Stock-Based Compensation
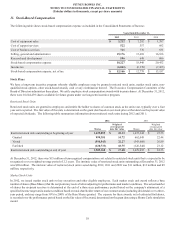
The following table shows stock-based compensation expense as included in the Consolidated Statements of Income:
Years Ended December 31,
2012 2011 2010
Cost of equipment sales $ 1,212 $ 1,292 $ 1,397
Cost of support services 522 557 602
Cost of business services 721 770 831
Selling, general and administrative 15,176 15,689 16,936
Research and development 596 640 686
Stock-based compensation expense 18,227 18,948 20,452
Income tax (6,061)(6,170) (7,265)
Stock-based compensation expense, net of tax $ 12,166 $ 12,778 $ 13,187
Stock Plans
We have a long-term incentive program whereby eligible employees may be granted restricted stock units, market stock units, non-
qualified stock options, other stock-based awards, cash or any combination thereof. The Executive Compensation Committee of the
Board of Directors administers these plans. We settle employee stock compensation awards with treasury shares. At December 31, 2012,
there were 16,644,439 shares available for future grants under our long-term incentive program.
Restricted Stock Units
Restricted stock units are granted to employees and entitle the holder to shares of common stock as the units vest, typically over a four
year service period. The fair value of the units is determined on the grant date based on our stock price at that date less the present value
of expected dividends. The following table summarizes information about restricted stock units during 2012 and 2011:
2012 2011
Shares
Weighted
average grant
date fair value Shares
Weighted
average grant
date fair value
Restricted stock units outstanding at beginning of year 1,629,055 $ 22.33 1,637,242 $ 25.55
Granted 999,381 14.72 662,049 22.44
Vested (598,543) 22.27 (543,688) 26.89
Forfeited (120,733) 18.75 (126,548) 23.12
Restricted stock units outstanding at end of year 1,909,160 $ 17.68 1,629,055 $ 22.33
At December 31, 2012, there was $15 million of unrecognized compensation cost related to restricted stock units that is expected to be
recognized over a weighted-average period of 2.2 years. The intrinsic value of restricted stock units outstanding at December 31, 2012
was $20 million. The intrinsic value of restricted stock units vested during 2012, 2011 and 2010 was $11 million, $13 million and $9
million, respectively.
Market Stock Units
In 2012, we issued market stock units to key executives and other eligible employees. Each market stock unit award reflects a base
number of shares (Base Shares) that the recipient may receive before adjusting for performance and market conditions. The actual number
of shares the recipient receives is determined at the end of a three-year performance period based on the company's attainment of a
specified income target and a market condition based on total shareholder return of our common stock (including dividends) over a three-
year period, and may range from 50% to 200% of the Base Shares granted. The expense for these awards, net of estimated forfeitures,
is recorded over the performance period based on the fair value of the award, determined on the grant date using a Monte Carlo simulation
model.


