Pitney Bowes 2012 Annual Report Download - page 93
Download and view the complete annual report
Please find page 93 of the 2012 Pitney Bowes annual report below. You can navigate through the pages in the report by either clicking on the pages listed below, or by using the keyword search tool below to find specific information within the annual report.-
 1
1 -
2
-
3
-
4
-
5
-
6
-
7
-
8
-
9
-
10
-
11
-
12
-
13
-
14
-
15
-
16
-
17
-
18
-
19
-
20
-
21
-
22
-
23
-
24
-
25
-
26
-
27
-
28
-
29
-
30
-
31
-
32
-
33
-
34
-
35
-
36
-
37
-
38
-
39
-
40
-
41
-
42
-
43
-
44
-
45
-
46
-
47
-
48
-
49
-
50
-
51
-
52
-
53
-
54
-
55
-
56
-
57
-
58
-
59
-
60
-
61
-
62
-
63
-
64
-
65
-
66
-
67
-
68
-
69
-
70
-
71
-
72
-
73
-
74
-
75
-
76
-
77
-
78
-
79
-
80
-
81
-
82
-
 83
83 -
 84
84 -
 85
85 -
 86
86 -
 87
87 -
 88
88 -
 89
89 -
 90
90 -
 91
91 -
 92
92 -
 93
93 -
 94
94 -
 95
95 -
 96
96 -
 97
97 -
 98
98 -
 99
99 -
 100
100 -
 101
101 -
 102
102 -
 103
103 -
104
-
105
-
106
-
107
-
108
-
109
-
110
-
111
-
112
-
113
-
114
-
115
-
116
 |
 |

PITNEY BOWES INC.
NOTES TO CONSOLIDATED FINANCIAL STATEMENTS
(Tabular dollars in thousands, except per share amounts)
75
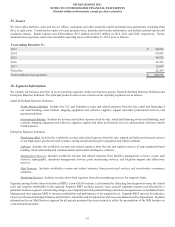
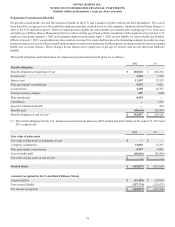
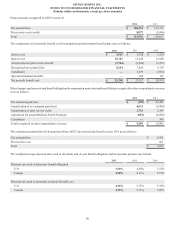
The target asset allocation used to manage the investment portfolio is based on the broad asset categories shown above. The plan asset
categories presented in the fair value hierarchy are subsets of the broad asset categories.
The fair value of the U.K. plan assets was $370 million and $326 million at December 31, 2012 and 2011, respectively, and the expected
long-term rate of return on these plan assets was 7.25% in both 2012 and 2011.
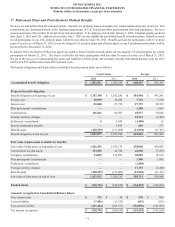
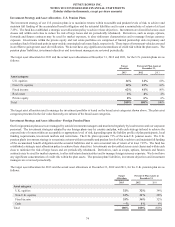
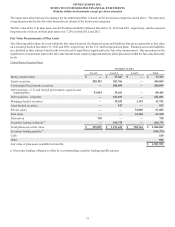
Fair Value Measurements of Plan Assets
The following tables show, by level within the fair value hierarchy, the financial assets and liabilities that are accounted for at fair value
on a recurring basis at December 31, 2012 and 2011, respectively, for the U.S. and foreign pension plans. Financial assets and liabilities
are classified in their entirety based on the lowest level of input that is significant to the fair value measurement. Our assessment of the
significance of a particular input to the fair value measurement requires judgment and may affect placement within the fair value hierarchy
levels.
United States Pension Plans
December 31, 2012
Level 1 Level 2 Level 3 Total
Money market funds $ — $ 17,363 $ — $ 17,363
Equity securities 250,303 203,766 — 454,069
Commingled fixed income securities — 200,899 — 200,899
Debt securities - U.S. and foreign governments, agencies and
municipalities 53,984 35,461 — 89,445
Debt securities - corporate — 621,691 — 621,691
Mortgage-backed securities — 39,552 3,191 42,743
Asset-backed securities — 547 — 547
Private equity — — 91,805 91,805
Real estate — — 63,168 63,168
Derivatives 738 — — 738
Securities lending collateral (1) — 104,375 — 104,375
Total plan assets at fair value $ 305,025 $ 1,223,654 $ 158,164 $ 1,686,843
Securities lending payable (1) (104,375)
Cash 618
Other 846
Fair value of plan assets available for benefits $ 1,583,932
(1) Securities lending collateral is offset by a corresponding securities lending payable amount.