Pitney Bowes 2012 Annual Report Download - page 31
Download and view the complete annual report
Please find page 31 of the 2012 Pitney Bowes annual report below. You can navigate through the pages in the report by either clicking on the pages listed below, or by using the keyword search tool below to find specific information within the annual report.-
 1
1 -
2
-
3
-
4
-
5
-
6
-
7
-
8
-
9
-
10
-
11
-
12
-
13
-
14
-
15
-
16
-
17
-
18
-
19
-
20
-
 21
21 -
 22
22 -
 23
23 -
 24
24 -
 25
25 -
 26
26 -
 27
27 -
 28
28 -
 29
29 -
 30
30 -
 31
31 -
 32
32 -
 33
33 -
 34
34 -
 35
35 -
 36
36 -
 37
37 -
 38
38 -
 39
39 -
 40
40 -
 41
41 -
42
-
43
-
44
-
45
-
46
-
47
-
48
-
49
-
50
-
51
-
52
-
53
-
54
-
55
-
56
-
57
-
58
-
59
-
60
-
61
-
62
-
63
-
64
-
65
-
66
-
67
-
68
-
69
-
70
-
71
-
72
-
73
-
74
-
75
-
76
-
77
-
78
-
79
-
80
-
81
-
82
-
83
-
84
-
85
-
86
-
87
-
88
-
89
-
90
-
91
-
92
-
93
-
94
-
95
-
96
-
97
-
98
-
99
-
100
-
101
-
102
-
103
-
104
-
105
-
106
-
107
-
108
-
109
-
110
-
111
-
112
-
113
-
114
-
115
-
116
 |
 |

13
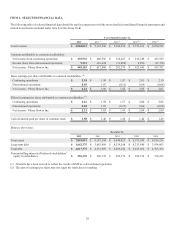
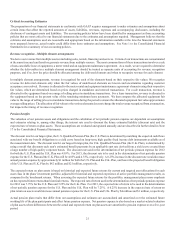
Cost of revenue
Year Ended December 31,
2012 2011 2010
$ % of revenue $ % of revenue $ % of revenue
Cost of equipment sales $ 459 48.9% $ 449 45.6 % $ 469 45.9%
Cost of supplies 88 30.9% 97 31.6 % 97 30.5%
Cost of software 93 22.5% 99 23.2 % 93 23.9%
Cost of rentals 115 20.3% 139 22.4 % 155 23.9%
Financing interest expense 81 16.4% 88 16.0 % 88 15.0%
Cost of support services 440 63.8% 453 64.1 % 452 63.5%
Cost of business services 1,157 76.4% 1,161 76.0 % 1,173 74.3%
Total cost of revenue $ 2,433 49.6% $ 2,486 48.5 % $ 2,529 48.1%
Equipment sales
Equipment sales revenue decreased 5% to $938 million in 2012 compared to 2011 as worldwide economic conditions continue to impact
customer purchasing behavior. Foreign currency translation had an unfavorable impact on revenue of 2%. Cost of equipment sales as
a percentage of revenue increased to 48.9% compared to 45.6% in the prior year primarily due to a higher mix of lower margin product
sales, pricing pressure on competitive placements and a decline in the number of lease extensions relative to prior year.
In 2011, equipment sales revenue decreased 4% to $986 million compared to 2010, including a positive impact of 2% from foreign
currency translation. Equipment sales were adversely impacted as many customers delayed capital investment commitments and extended
leases of existing equipment. Cost of equipment sales as a percentage of revenue improved to 45.6% compared with 45.9% in the prior
year due to the mix of higher margin product sales and lease extensions.
Supplies
Supplies revenue decreased 8% to $284 million in 2012 compared to 2011 primarily due to reduced mail volumes, fewer installed meters
worldwide and lower ink and toner sales. Foreign currency translation had a 2% unfavorable impact on revenue. Cost of supplies as a
percentage of revenue was 30.9% compared to 31.6% in the prior year primarily due to a favorable mix of higher margin core supplies
sales.
Supplies revenue in 2011 decreased 3% to $308 million compared to 2010 due to reduced mail volumes and fewer installed meters
worldwide. Foreign currency translation had a 2% favorable impact. Cost of supplies as a percentage of revenue was 31.6% compared
with 30.5% in the prior year primarily due to the mix of lower margin supply sales worldwide.
Software
Software revenue decreased 3% to $413 million in 2012 compared to 2011. Foreign currency translation had a 1% unfavorable impact
on revenue. The decrease was primarily attributable to weak economic conditions and constrained public sector spending in Europe and
lower sales in Asia Pacific. Cost of software as a percentage of revenue improved to 22.5% compared with 23.2% in the prior year
primarily due to reduced headcount.
Software revenue in 2011 increased 9% to $427 million compared to 2010 driven by higher licensing revenue (3%), the full year impact
of 2010 acquisitions (3%) and foreign currency translation (3%). Cost of software as a percentage of revenue improved to 23.2% compared
with 23.9% in the prior year due to the increase in high margin licensing revenue.
Rentals
Rentals revenue decreased 8% to $570 million in 2012 compared to 2011 primarily due to declines in North America from fewer meters
in service and lower rentals in France due to a change in mix from rental to equipment sales. Foreign currency translation had an
unfavorable impact on revenue of 1%. Cost of rentals as a percentage of revenue improved to 20.3% compared with 22.4% in the prior
year mainly due to lower depreciation expense.
Rentals revenue decreased 5% to $619 million in 2011 compared to 2010 as customers in the U.S. continued to downsize to smaller, fully
featured machines and fewer installed meters worldwide. Foreign currency translation had a 1% positive impact. Cost of rentals as a
percentage of revenue improved to 22.4% compared with 23.9% in the prior year primarily due to lower depreciation associated with
higher levels of lease extensions.