Pitney Bowes 2012 Annual Report Download - page 102
Download and view the complete annual report
Please find page 102 of the 2012 Pitney Bowes annual report below. You can navigate through the pages in the report by either clicking on the pages listed below, or by using the keyword search tool below to find specific information within the annual report.-
 1
1 -
2
-
3
-
4
-
5
-
6
-
7
-
8
-
9
-
10
-
11
-
12
-
13
-
14
-
15
-
16
-
17
-
18
-
19
-
20
-
21
-
22
-
23
-
24
-
25
-
26
-
27
-
28
-
29
-
30
-
31
-
32
-
33
-
34
-
35
-
36
-
37
-
38
-
39
-
40
-
41
-
42
-
43
-
44
-
45
-
46
-
47
-
48
-
49
-
50
-
51
-
52
-
53
-
54
-
55
-
56
-
57
-
58
-
59
-
60
-
61
-
62
-
63
-
64
-
65
-
66
-
67
-
68
-
69
-
70
-
71
-
72
-
73
-
74
-
75
-
76
-
77
-
78
-
79
-
80
-
81
-
82
-
83
-
84
-
85
-
86
-
87
-
88
-
89
-
90
-
91
-
 92
92 -
 93
93 -
 94
94 -
 95
95 -
 96
96 -
 97
97 -
 98
98 -
 99
99 -
 100
100 -
 101
101 -
 102
102 -
 103
103 -
 104
104 -
 105
105 -
 106
106 -
 107
107 -
 108
108 -
 109
109 -
 110
110 -
 111
111 -
 112
112 -
113
-
114
-
115
-
116
 |
 |

PITNEY BOWES INC.
NOTES TO CONSOLIDATED FINANCIAL STATEMENTS
(Tabular dollars in thousands, except per share amounts)
84
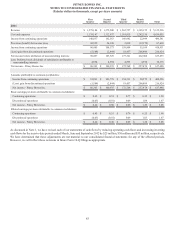
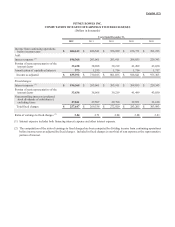
20. Quarterly Financial Data (unaudited)
The following table sets forth selected unaudited quarterly data for the years ended December 31, 2012 and 2011. The amounts in the
tables below have been revised from the amounts previously filed to reflect the results of IMS as a discontinued operation (see Note 18).
The sum of the quarterly earnings per share amounts may not equal the quarterly total or annual amount due to rounding.
First
Quarter
Second
Quarter
Third
Quarter
Fourth
Quarter Total
2012
Revenue $ 1,220,136 $ 1,213,356 $ 1,183,216 $ 1,287,307 $ 4,904,015
Cost and expenses 1,059,107 1,055,241 1,045,515 1,139,539 4,299,402
Income from continuing operations 161,029 158,115 137,701 147,768 604,613
Provision for income taxes 15,493 52,765 37,823 44,224 150,305
Income from continuing operations 145,536 105,350 99,878 103,544 454,308
Gain (loss) from discontinued operations 17,728 (1,133) (18,751) 11,387 9,231
Net income before attribution of noncontrolling interests 163,264 104,217 81,127 114,931 463,539
Less: Preferred stock dividends of subsidiaries attributable to
noncontrolling interests 4,594 4,594 4,594 4,594 18,376
Net income - Pitney Bowes Inc. $ 158,670 $ 99,623 $ 76,533 $ 110,337 $ 445,163
Amounts attributable to common stockholders:
Income from continuing operations $ 140,942 $ 100,756 $ 95,284 $ 98,950 $ 435,932
Gain from discontinued operations 17,728 (1,133) (18,751) 11,387 9,231
Net income - Pitney Bowes Inc. $ 158,670 $ 99,623 $ 76,533 $ 110,337 $ 445,163
Basic earnings per share attributable to common stockholders:
Continuing operations $ 0.70 $ 0.50 $ 0.48 $ 0.49 $ 2.18
Discontinued operations 0.09 (0.01) (0.09) 0.06 0.05
Net income - Pitney Bowes Inc. $ 0.79 $ 0.50 $ 0.38 $ 0.55 $ 2.22
Diluted earnings per share attributable to common stockholders:
Continuing operations $ 0.70 $ 0.50 $ 0.47 $ 0.49 $ 2.16
Discontinued operations 0.09 (0.01) (0.09) 0.06 0.05
Net income - Pitney Bowes Inc. $ 0.79 $ 0.50 $ 0.38 $ 0.55 $ 2.21
(loss)