Pitney Bowes 2012 Annual Report Download - page 77
Download and view the complete annual report
Please find page 77 of the 2012 Pitney Bowes annual report below. You can navigate through the pages in the report by either clicking on the pages listed below, or by using the keyword search tool below to find specific information within the annual report.-
 1
1 -
2
-
3
-
4
-
5
-
6
-
7
-
8
-
9
-
10
-
11
-
12
-
13
-
14
-
15
-
16
-
17
-
18
-
19
-
20
-
21
-
22
-
23
-
24
-
25
-
26
-
27
-
28
-
29
-
30
-
31
-
32
-
33
-
34
-
35
-
36
-
37
-
38
-
39
-
40
-
41
-
42
-
43
-
44
-
45
-
46
-
47
-
48
-
49
-
50
-
51
-
52
-
53
-
54
-
55
-
56
-
57
-
58
-
59
-
60
-
61
-
62
-
63
-
64
-
65
-
66
-
 67
67 -
 68
68 -
 69
69 -
 70
70 -
 71
71 -
 72
72 -
 73
73 -
 74
74 -
 75
75 -
 76
76 -
 77
77 -
 78
78 -
 79
79 -
 80
80 -
 81
81 -
 82
82 -
 83
83 -
 84
84 -
 85
85 -
 86
86 -
 87
87 -
88
-
89
-
90
-
91
-
92
-
93
-
94
-
95
-
96
-
97
-
98
-
99
-
100
-
101
-
102
-
103
-
104
-
105
-
106
-
107
-
108
-
109
-
110
-
111
-
112
-
113
-
114
-
115
-
116
 |
 |

PITNEY BOWES INC.
NOTES TO CONSOLIDATED FINANCIAL STATEMENTS
(Tabular dollars in thousands, except per share amounts)
59
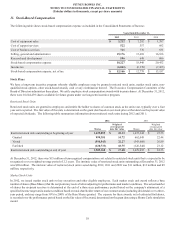
The following table summarizes information about market stock units during 2012:
Shares
Weighted
average grant
date fair value
Market stock units outstanding at January 1, 2012 — $ —
Granted 205,013 17.91
Forfeited (6,868) 17.91
Market stock units outstanding at December 31, 2012 198,145 $ 17.91
The fair value of market stock units was determined based on the following assumptions:
Year Ended
December 31, 2012
Expected dividend yield 6.7%
Expected stock price volatility 29.7%
Risk-free interest rate 0.4%
At December 31, 2012, there was $1 million of unrecognized compensation cost related to market stock units that is expected to be
recognized over a weighted-average period of 1.6 years.
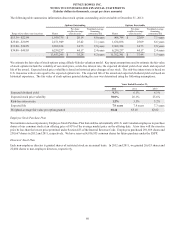
Stock Options
Under our stock option plan, certain officers and employees are granted options at prices equal to the market value of our common shares
at the date of grant. Options vest ratably over three or four years and expire ten years from the date of grant.
The following table summarizes information about stock option activity during 2012 and 2011:
2012 2011
Shares
Per share
weighted
average
exercise prices Shares
Per share
weighted
average exercise
prices
Options outstanding at beginning of the year 14,471,464 $ 36.42 14,506,522 $ 37.38
Granted 600,000 15.71 1,312,910 26.07
Exercised ——
(55,484) 25.15
Canceled (525,361) 36.15 (1,266,537) 37.61
Forfeited (892,858) 40.20 (25,947) 27.27
Options outstanding at the end of the year 13,653,245 $ 35.28 14,471,464 $ 36.42
Options exercisable at the end of the year 11,762,341 $ 37.44 11,478,630 $ 39.13
At December 31, 2012, there was $1 million of unrecognized compensation cost related to stock options that is expected to be recognized
over a weighted-average period of 1.7 years. The options outstanding and exercisable at December 31, 2012 had no intrinsic value. There
were no options exercised in 2012 or 2010 and the intrinsic value of options exercised in 2011 was less than $1 million.