Pitney Bowes 2012 Annual Report Download - page 17
Download and view the complete annual report
Please find page 17 of the 2012 Pitney Bowes annual report below. You can navigate through the pages in the report by either clicking on the pages listed below, or by using the keyword search tool below to find specific information within the annual report.-
 1
1 -
2
-
3
-
4
-
5
-
6
-
 7
7 -
 8
8 -
 9
9 -
 10
10 -
 11
11 -
 12
12 -
 13
13 -
 14
14 -
 15
15 -
 16
16 -
 17
17 -
 18
18 -
 19
19 -
 20
20 -
 21
21 -
 22
22 -
 23
23 -
 24
24 -
 25
25 -
 26
26 -
 27
27 -
28
-
29
-
30
-
31
-
32
-
33
-
34
-
35
-
36
-
37
-
38
-
39
-
40
-
41
-
42
-
43
-
44
-
45
-
46
-
47
-
48
-
49
-
50
-
51
-
52
-
53
-
54
-
55
-
56
-
57
-
58
-
59
-
60
-
61
-
62
-
63
-
64
-
65
-
66
-
67
-
68
-
69
-
70
-
71
-
72
-
73
-
74
-
75
-
76
-
77
-
78
-
79
-
80
-
81
-
82
-
83
-
84
-
85
-
86
-
87
-
88
-
89
-
90
-
91
-
92
-
93
-
94
-
95
-
96
-
97
-
98
-
99
-
100
-
101
-
102
-
103
-
104
-
105
-
106
-
107
-
108
-
109
-
110
-
111
-
112
-
113
-
114
-
115
-
116
 |
 |

15Pitney Bowes Annual Report 2012
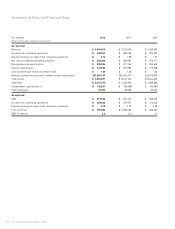
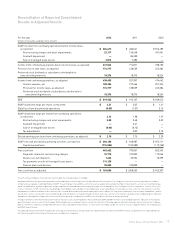
Reconciliation of Reported Consolidated
Results to Adjusted Results
For the year 2012 2011 2010
(Dollars in thousands, except per share amounts)
GAAP income from continuing operations before income taxes,
as reported $ 604,613 $ 486,541 $ 556,189
Restructuring charges and asset impairments 23,117 136,548 181,961
Goodwill impairment — 84,500 —
Sale of leveraged lease assets 3,816 7,282 —
Income from continuing operations before income taxes, as adjusted 631,546 714,871 738,150
Provision for income taxes, as adjusted 174,717 138,539 245,384
Preferred stock dividends of subsidiaries attributable to
noncontrolling interests 18,376 18,375 18,324
Income from continuing operations, as adjusted 438,453 557,957 474,442
Interest expense, net 188,386 197,266 201,324
Provision for income taxes, as adjusted 174,717 138,539 245,384
Preferred stock dividends of subsidiaries attributable to
noncontrolling interests 18,376 18,375 18,324
EBIT $ 819,932 $ 912,137 $ 939,474
GAAP diluted earnings per share, as reported $ 2.21 $ 3.05 $ 1.41
(Gain) loss from discontinued operations (0.05) (1.07) 0.15
GAAP diluted earnings per share from continuing operations,
as reported 2.16 1.98 1.57
Restructuring charges and asset impairments 0.08 0.48 0.59
Goodwill impairment — 0.41 —
Sale of leveraged lease assets (0.06) (0.13) —
Tax adjustments — 0.02 0.13
Diluted earnings per share from continuing operations, as adjusted $ 2.18 $ 2.75 $ 2.29
GAAP net cash provided by operating activities, as reported $ 660,188 $ 948,987 $ 952,111
Capital expenditures (176,586) (155,980) (119,768)
Free cash flow 483,602 793,007 832,343
Payments related to restructuring charges 74,718 107,002 119,565
Reserve account deposits 1,636 35,354 10,399
Tax payments on sale of leveraged lease assets 114,128 — —
Pension plan contributions 95,000 123,000 —
Free cash flow, as adjusted $ 769,084 $ 1,058,363 $ 962,307
The sum of the earnings per share amounts may not equal the totals above due to rounding.
Management believes this presentation provides a reasonable basis on which to present the adjusted financial information. The Company’s financial results are reported in accordance
with generally accepted accounting principles (GAAP). The earnings per share and free cash flow results are adjusted to exclude the impact of special items such as restructuring charges
and asset impairments, goodwill impairment charges and other income and expense that materially impact the comparability of the Company’s results of operations. The use of free cash
flow has limitations. GAAP cash flow has the advantage of including all cash available to the Company after actual expenditures for all purposes. Free cash flow is the amount of cash that
management could have available for discretionary uses if it made different decisions about employing its cash. It adjusts for long-term commitments such as capital expenditures, and for
special items such as cash used for restructuring charges and contributions to its pension funds. All these items use cash that is not otherwise available to the Company and are important
expenditures. Management compensates for these limitations by using a combination of GAAP cash flow and free cash flow in doing its planning.
The adjusted financial information and certain financial measures such as earnings before interest and taxes (EBIT) and EBIT to interest are intended to be more indicative of the ongoing
operations and economic results of the Company. EBIT excludes interest and taxes and, as a result, has the effect of showing a greater amount of earnings than net income. The Company
believes that interest and taxes, though important, do not reflect management effectiveness, as these items are largely outside of its control. In assessing performance, the Company uses
both EBIT and net income.
This adjusted financial information should not be construed as an alternative to our reported results determined in accordance with GAAP. Further, our definition of this adjusted financial
information may differ from similarly titled measures used by other companies.