Pitney Bowes 2012 Annual Report Download - page 81
Download and view the complete annual report
Please find page 81 of the 2012 Pitney Bowes annual report below. You can navigate through the pages in the report by either clicking on the pages listed below, or by using the keyword search tool below to find specific information within the annual report.-
 1
1 -
2
-
3
-
4
-
5
-
6
-
7
-
8
-
9
-
10
-
11
-
12
-
13
-
14
-
15
-
16
-
17
-
18
-
19
-
20
-
21
-
22
-
23
-
24
-
25
-
26
-
27
-
28
-
29
-
30
-
31
-
32
-
33
-
34
-
35
-
36
-
37
-
38
-
39
-
40
-
41
-
42
-
43
-
44
-
45
-
46
-
47
-
48
-
49
-
50
-
51
-
52
-
53
-
54
-
55
-
56
-
57
-
58
-
59
-
60
-
61
-
62
-
63
-
64
-
65
-
66
-
67
-
68
-
69
-
70
-
 71
71 -
 72
72 -
 73
73 -
 74
74 -
 75
75 -
 76
76 -
 77
77 -
 78
78 -
 79
79 -
 80
80 -
 81
81 -
 82
82 -
 83
83 -
 84
84 -
 85
85 -
 86
86 -
 87
87 -
 88
88 -
 89
89 -
 90
90 -
 91
91 -
92
-
93
-
94
-
95
-
96
-
97
-
98
-
99
-
100
-
101
-
102
-
103
-
104
-
105
-
106
-
107
-
108
-
109
-
110
-
111
-
112
-
113
-
114
-
115
-
116
 |
 |

PITNEY BOWES INC.
NOTES TO CONSOLIDATED FINANCIAL STATEMENTS
(Tabular dollars in thousands, except per share amounts)
63
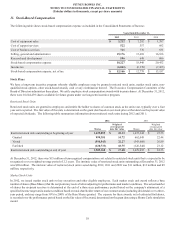
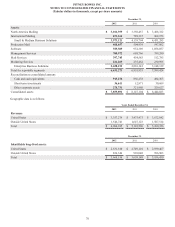
At December 31, 2012 and 2011, available-for-sale securities consisted of the following:
December 31, 2012
Amortized cost
Gross
unrealized
gains
Gross
unrealized
losses
Estimated fair
value
Money market funds / commercial paper $ 44,611 $ 53 $ — $ 44,664
U.S. and foreign governments, agencies and municipalities 127,807 3,972 (56) 131,723
Corporate 41,095 2,851 (20) 43,926
Mortgage-back / asset-back securities 162,180 3,340 (3,145) 162,375
Total $ 375,693 $ 10,216 $ (3,221) $ 382,688
December 31, 2011
Amortized cost
Gross unrealized
gains
Gross unrealized
losses
Estimated fair
value
Money market funds / commercial paper $ 25,253 $ 43 $ — $ 25,296
U.S. and foreign governments, agencies and municipalities 93,995 4,264 (8) 98,251
Corporate 31,114 935 (582) 31,467
Mortgage-back / asset-back securities 131,982 3,303 (1,023) 134,262
Total $ 282,344 $ 8,545 $ (1,613) $ 289,276
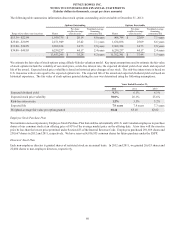
At December 31, 2012, the amortized cost and estimated fair value of investment securities have scheduled maturities as follows:
Amortized cost
Estimated fair
value
Within 1 year $ 86,867 $ 87,014
After 1 year through 5 years 56,732 58,117
After 5 years through 10 years 65,019 65,869
After 10 years 167,075 171,688
Total $ 375,693 $ 382,688
We have not experienced any write-offs in our investment portfolio. The majority of our MBS are either guaranteed or supported by the
U.S. government. We have no investments in inactive markets that would warrant a possible change in our pricing methods or classification
within the fair value hierarchy. Further, we have no investments in auction rate securities.
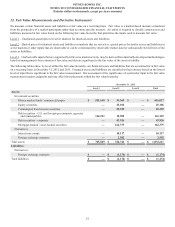
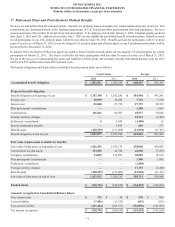
Derivative Instruments
In the normal course of business, we are exposed to the impact of interest rate changes and foreign currency fluctuations. We limit these
risks by following established risk management policies and procedures, including the use of derivatives. We use derivatives to manage
the related cost of debt and to limit the effects of foreign exchange rate fluctuations on financial results. We do not use derivatives for
trading or speculative purposes. We record our derivative instruments at fair value. The accounting for changes in the fair value of the
derivatives depends on the intended use of the derivative, the resulting designation and the effectiveness of the instrument in offsetting
the risk exposure it is designed to hedge.
As required by the fair value measurements guidance, we have incorporated counterparty credit risk and our credit risk into the fair value
measurement of our derivative assets and liabilities, respectively. We derive credit risk from observable data related to credit default
swaps. We have not seen a material change in the creditworthiness of those banks acting as derivative counterparties.
The valuation of our interest rate swaps is based on the income approach using a model with inputs that are observable or that can be
derived from or corroborated by observable market data. The valuation of our foreign exchange derivatives is based on the market approach
using observable market inputs, such as forward rates.