Pep Boys 2005 Annual Report Download - page 7
Download and view the complete annual report
Please find page 7 of the 2005 Pep Boys annual report below. You can navigate through the pages in the report by either clicking on the pages listed below, or by using the keyword search tool below to find specific information within the annual report.-
 1
1 -
 2
2 -
 3
3 -
 4
4 -
 5
5 -
 6
6 -
 7
7 -
 8
8 -
 9
9 -
 10
10 -
 11
11 -
 12
12 -
 13
13 -
 14
14 -
 15
15 -
 16
16 -
 17
17 -
 18
18 -
19
-
20
-
21
-
22
-
23
-
24
-
25
-
26
-
27
-
28
-
29
-
30
-
31
-
32
-
33
-
34
-
35
-
36
-
37
-
38
-
39
-
40
-
41
-
42
-
43
-
44
-
45
-
46
-
47
-
48
-
49
-
50
-
51
-
52
-
53
-
54
-
55
-
56
-
57
-
58
-
59
-
60
-
61
-
62
-
63
-
64
-
65
-
66
-
67
-
68
-
69
-
70
-
71
-
72
-
73
-
74
-
75
-
76
-
77
-
78
-
79
-
80
-
81
-
82
-
83
-
84
-
85
-
86
-
87
-
88
-
89
-
90
-
91
-
92
-
93
 |
 |

2
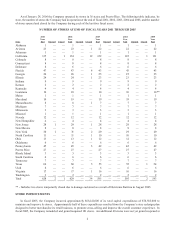
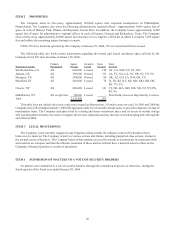
As of January 28, 2006 the Company operated its stores in 36 states and Puerto Rico. The following table indicates, by
state, the number of stores the Company had in operation at the end of fiscal 2001, 2002, 2003, 2004 and 2005, and the number
of stores opened and closed by the Company during each of the last four fiscal years:
NUMBER OF STORES AT END OF FISCAL YEARS 2001 THROUGH 2005
State
2001
Year
End Opened Closed
2002
Year
End Opened Closed
2003
Year
End Opened Closed
2004
Year
End Opened Closed
2005
Year
End
Alabama 1 —— 1 —— 1 —— 1 —— 1
Arizona 23——23— 122——22——22
Arkansas 1—— 1—— 1—— 1—— 1
California 135 — 1 134 — 12 122 — — 122 — 1 121
Colorado 8—— 8—— 8—— 8—— 8
Connecticut 8 —— 8 —— 8 —— 8 —— 8
Delaware 6—— 6—— 6—— 6—— 6
Florida 47——47— 443——43——43
Georgia 26——26— 125——25——25
Illinois 24 ——24 — 123 ——23 ——23
Indiana 9 —— 9 —— 9 —— 9 —— 9
Kansas 2—— 2—— 2—— 2—— 2
Kentucky 4—— 4—— 4—— 4—— 4
Louisiana 10——10——10——10——10**
Maine 1 —— 1 —— 1 —— 1 —— 1
Maryland 19 — — 19 — — 19 — — 19 — — 19
Massachusetts 8 —— 8 — 1 7 —— 7 —— 7
Michigan 7—— 7—— 7—— 7—— 7
Minnesota 3 —— 3 —— 3 —— 3 —— 3
Missouri 1—— 1—— 1—— 1—— 1
Nevada 12 — — 12 — — 12 — — 12 — — 12
New Hampshire 4 —— 4 —— 4 —— 4 —— 4
New Jersey 28 1 — 29 — 1 28 — — 28 — — 28
New Mexico 8—— 8—— 8—— 8—— 8
New York 30 1—31 — 229 ——29 ——29
North Carolina 11 ——11 — 110 ——10 ——10
Ohio 13 ——13 — 112 ——12 ——12
Oklahoma 6—— 6—— 6—— 6—— 6
Pennsylvania 45 ——45 — 342 ——42 ——42
Puerto Rico 27 — — 27 — — 27 — — 27 — — 27
Rhode Island 3 — — 3 — — 3 — — 3 — — 3
South Carolina 6—— 6—— 6—— 6—— 6
Tennessee 7 —— 7 —— 7 —— 7 —— 7
Texas 60——60— 555——55— 154
Utah 6—— 6—— 6—— 6—— 6
Virginia 17 ——17 — 116 ——16 ——16
Washington 2—— 2—— 2—— 2—— 2
Total 628 2 1629—34595——595— 2593
** - Includes two stores temporarily closed due to damage sustained as a result of Hurricane Katrina in August 2005.
STORE IMPROVEMENTS
In fiscal 2005, the Company incurred approximately $68,141,000 of its total capital expenditures of $76,385,000 to
maintain and improve its stores. Approximately half of these expenditures resulted from the Company’s store redesign plan
designed to better merchandise its retail business, to promote cross-selling and improve the overall customer experience. In
fiscal 2005, the Company remodeled and grand reopened 181 stores. An additional 40 stores were not yet grand reopened at