Pep Boys 2005 Annual Report Download - page 6
Download and view the complete annual report
Please find page 6 of the 2005 Pep Boys annual report below. You can navigate through the pages in the report by either clicking on the pages listed below, or by using the keyword search tool below to find specific information within the annual report.-
 1
1 -
 2
2 -
 3
3 -
 4
4 -
 5
5 -
 6
6 -
 7
7 -
 8
8 -
 9
9 -
 10
10 -
 11
11 -
 12
12 -
 13
13 -
 14
14 -
 15
15 -
 16
16 -
 17
17 -
18
-
19
-
20
-
21
-
22
-
23
-
24
-
25
-
26
-
27
-
28
-
29
-
30
-
31
-
32
-
33
-
34
-
35
-
36
-
37
-
38
-
39
-
40
-
41
-
42
-
43
-
44
-
45
-
46
-
47
-
48
-
49
-
50
-
51
-
52
-
53
-
54
-
55
-
56
-
57
-
58
-
59
-
60
-
61
-
62
-
63
-
64
-
65
-
66
-
67
-
68
-
69
-
70
-
71
-
72
-
73
-
74
-
75
-
76
-
77
-
78
-
79
-
80
-
81
-
82
-
83
-
84
-
85
-
86
-
87
-
88
-
89
-
90
-
91
-
92
-
93
 |
 |

1
PART I
ITEM 1 BUSINESS
GENERAL
The Pep Boys—Manny, Moe & Jack and subsidiaries (the “Company”) is a leading automotive retail and service chain.
The Company operates in one industry, the automotive aftermarket. The Company is engaged principally in the retail sale of
automotive parts, tires and accessories, automotive repairs and maintenance and the installation of parts. The Company’s
primary operating unit is its SUPERCENTER format. As of January 28, 2006, the Company operated 593 stores consisting
of 582 SUPERCENTERS and one SERVICE & TIRE CENTER, having an aggregate of 6,162 service bays, as well as 10 non-
service/non-tire format PEP BOYS EXPRESS stores. The Company operates approximately 12,167,000 gross square feet of
retail space, including service bays. The SUPERCENTERS average approximately 20,700 square feet and the 10 PEP BOYS
EXPRESS stores average approximately 9,700 square feet. The Company believes that its unique SUPERCENTER format
offers the broadest capabilities in the industry and positions the Company to gain market share and increase its profitability
by serving “do-it-yourself” (retail) and “do-it-for-me” (service labor, installed merchandise and tires) customers with the
highest quality merchandise and service offerings.
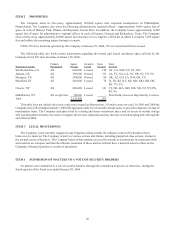
The following table sets forth the percentage of total revenues from continuing operations contributed by each class of
similar products or services for the Company and should be read in conjunction with the Consolidated Financial Statements
and Notes thereto included elsewhere herein:
Year ended
Jan. 28,
2006
Jan. 29,
2005
Jan. 31,
2004
Parts and Accessories 69.3% 67.8% 65.2%
Tires 13.6 14.2 15.8
Total Merchandise Sales 82.9 82.0 81.0
Service 17.1 18.0 19.0
Total Revenues 100.0% 100.0% 100.0%