Pep Boys 2005 Annual Report Download - page 61
Download and view the complete annual report
Please find page 61 of the 2005 Pep Boys annual report below. You can navigate through the pages in the report by either clicking on the pages listed below, or by using the keyword search tool below to find specific information within the annual report.-
 1
1 -
2
-
3
-
4
-
5
-
6
-
7
-
8
-
9
-
10
-
11
-
12
-
13
-
14
-
15
-
16
-
17
-
18
-
19
-
20
-
21
-
22
-
23
-
24
-
25
-
26
-
27
-
28
-
29
-
30
-
31
-
32
-
33
-
34
-
35
-
36
-
37
-
38
-
39
-
40
-
41
-
42
-
43
-
44
-
45
-
46
-
47
-
48
-
49
-
50
-
 51
51 -
 52
52 -
 53
53 -
 54
54 -
 55
55 -
 56
56 -
 57
57 -
 58
58 -
 59
59 -
 60
60 -
 61
61 -
 62
62 -
 63
63 -
 64
64 -
 65
65 -
 66
66 -
 67
67 -
 68
68 -
 69
69 -
 70
70 -
 71
71 -
72
-
73
-
74
-
75
-
76
-
77
-
78
-
79
-
80
-
81
-
82
-
83
-
84
-
85
-
86
-
87
-
88
-
89
-
90
-
91
-
92
-
93
 |
 |

56
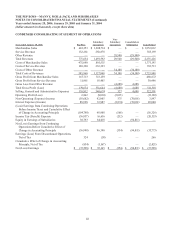
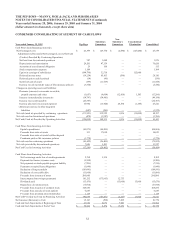
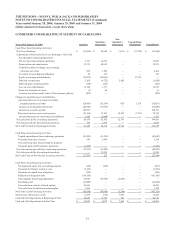
THE PEP BOYS—MANNY, MOE & JACK AND SUBSIDIARIES
NOTES TO CONSOLIDATED FINANCIAL STATEMENTS (Continued)
Years ended January 28, 2006, January 29, 2005 and January 31, 2004
(dollar amounts in thousands, except share data)
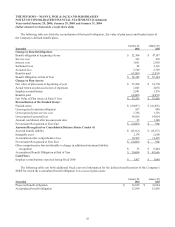
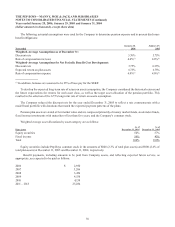
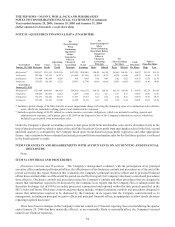
The following actuarial assumptions were used by the Company to determine pension expense and to present disclosure
benefit obligations:
Year ended
January 28,
2006
January 29,
2005
Weighted-Average Assumptions as of December 31:
Discount rate 5.70% 5.75%
Rate of compensation increase 4.0%(1) 4.0%(1)
Weighted-Average Assumptions for Net Periodic Benefit Cost Development:
Discount rate 5.75% 6.25%
Expected return on plan assets 6.75% 6.75%
Rate of compensation expense 4.0%(1) 4.0%(1)
(1) In addition, bonuses are assumed to be 25% of base pay for the SERP.
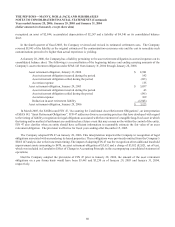
To develop the expected long-term rate of return on assets assumption, the Company considered the historical returns and
the future expectations for returns for each asset class, as well as the target asset allocation of the pension portfolio. This
resulted in the selection of the 6.75% long-term rate of return on assets assumption.
The Company reduced the discount rate for the year ended December 31, 2005 to reflect a rate commensurate with a
model bond portfolio with durations that match the expected payment patterns of the plans.
Pension plan assets are stated at fair market value and are composed primarily of money market funds, stock index funds,
fixed income investments with maturities of less than five years, and the Company’s common stock.
Weighted average asset allocations by asset category are as follows:
Plan Assets
As of
December 31, 2005
As of
December 31, 2005
Equity securities 50% 57%
Fixed income 50% 43%
Total 100% 100%
Equity securities include Pep Boys common stock in the amounts of $800 (2.3% of total plan assets) and $900 (2.6% of
total plan assets) at December 31, 2005 and December 31, 2004, respectively.
Benefit payments, including amounts to be paid from Company assets, and reflecting expected future service, as
appropriate, are expected to be paid as follows:
2006 $ 2,950
2007 3,206
2008 3,456
2009 4,538
2010 4,138
2011 – 2015 25,284