Pep Boys 2005 Annual Report Download - page 33
Download and view the complete annual report
Please find page 33 of the 2005 Pep Boys annual report below. You can navigate through the pages in the report by either clicking on the pages listed below, or by using the keyword search tool below to find specific information within the annual report.-
 1
1 -
2
-
3
-
4
-
5
-
6
-
7
-
8
-
9
-
10
-
11
-
12
-
13
-
14
-
15
-
16
-
17
-
18
-
19
-
20
-
21
-
22
-
 23
23 -
 24
24 -
 25
25 -
 26
26 -
 27
27 -
 28
28 -
 29
29 -
 30
30 -
 31
31 -
 32
32 -
 33
33 -
 34
34 -
 35
35 -
 36
36 -
 37
37 -
 38
38 -
 39
39 -
 40
40 -
 41
41 -
 42
42 -
 43
43 -
44
-
45
-
46
-
47
-
48
-
49
-
50
-
51
-
52
-
53
-
54
-
55
-
56
-
57
-
58
-
59
-
60
-
61
-
62
-
63
-
64
-
65
-
66
-
67
-
68
-
69
-
70
-
71
-
72
-
73
-
74
-
75
-
76
-
77
-
78
-
79
-
80
-
81
-
82
-
83
-
84
-
85
-
86
-
87
-
88
-
89
-
90
-
91
-
92
-
93
 |
 |
28
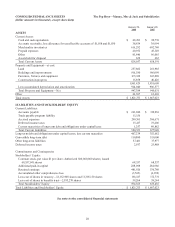
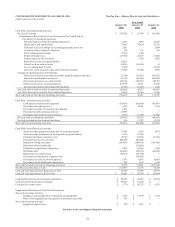
CONSOLIDATED BALANCE SHEETS The Pep Boys—Manny, Moe & Jack and Subsidiaries
(dollar amounts in thousands, except share data)
January 28,
2006
January 29,
2005
ASSETS
Current Assets:
Cash and cash equivalents $ 48,281 $ 82,758
Accounts receivable, less allowance for uncollectible accounts of $1,188 and $1,030 36,434 30,994
Merchandise inventories 616,292 602,760
Prepaid expenses 40,952 45,349
Other 85,446 96,065
Assets held for disposal 652 665
Total Current Assets 828,057 858,591
Property and Equipment—at cost:
Land 257,802 261,985
Buildings and improvements 916,580 916,099
Furniture, fixtures and equipment 671,189 633,098
Construction in progress 15,858 40,426
1,861,429 1,851,608
Less accumulated depreciation and amortization 914,040 906,577
Total Property and Equipment—Net 947,389 945,031
Other 46,307 63,401
Total Assets $ 1,821,753 $ 1,867,023
LIABILITIES AND STOCKHOLDERS’ EQUITY
Current Liabilities:
Accounts payable $ 261,940 $ 310,981
Trade payable program liability 11,156 -
Accrued expenses 290,761 306,671
Deferred income taxes 15,417 19,406
Current maturities of long-term debt and obligations under capital lease 1,257 40,882
Total Current Liabilities 580,531 677,940
Long-term debt and obligations under capital leases, less current maturities 467,239 352,682
Convertible long-term debt 119,000 119,000
Other long-term liabilities 57,481 37,977
Deferred income taxes 2,937 25,968
Commitments and Contingencies
Stockholders’ Equity:
Common stock, par value $1 per share: Authorized 500,000,000 shares; Issued
68,557,041 shares 68,557 68,557
Additional paid-in capital 288,098 284,966
Retained earnings 481,926 536,780
Accumulated other comprehensive loss (3,565) (4,852)
Less cost of shares in treasury—12,152,968 shares and 11,305,130 shares 181,187 172,731
Less cost of shares in benefits trust—2,195,270 shares 59,264 59,264
Total Stockholders’ Equity 594,565 653,456
Total Liabilities and Stockholders’ Equity $ 1,821,753 $ 1,867,023
See notes to the consolidated financial statements