Pep Boys 2005 Annual Report Download - page 18
Download and view the complete annual report
Please find page 18 of the 2005 Pep Boys annual report below. You can navigate through the pages in the report by either clicking on the pages listed below, or by using the keyword search tool below to find specific information within the annual report.-
 1
1 -
2
-
3
-
4
-
5
-
6
-
7
-
 8
8 -
 9
9 -
 10
10 -
 11
11 -
 12
12 -
 13
13 -
 14
14 -
 15
15 -
 16
16 -
 17
17 -
 18
18 -
 19
19 -
 20
20 -
 21
21 -
 22
22 -
 23
23 -
 24
24 -
 25
25 -
 26
26 -
 27
27 -
 28
28 -
29
-
30
-
31
-
32
-
33
-
34
-
35
-
36
-
37
-
38
-
39
-
40
-
41
-
42
-
43
-
44
-
45
-
46
-
47
-
48
-
49
-
50
-
51
-
52
-
53
-
54
-
55
-
56
-
57
-
58
-
59
-
60
-
61
-
62
-
63
-
64
-
65
-
66
-
67
-
68
-
69
-
70
-
71
-
72
-
73
-
74
-
75
-
76
-
77
-
78
-
79
-
80
-
81
-
82
-
83
-
84
-
85
-
86
-
87
-
88
-
89
-
90
-
91
-
92
-
93
 |
 |
13
ITEM 7 MANAGEMENT’S DISCUSSION AND ANALYSIS OF FINANCIAL CONDITION AND RESULTS OF
OPERATIONS
OVERVIEW
Introduction
Pep Boys is a leader in the automotive aftermarket, with 593 stores and more than 6,000 service bays located throughout
36 states and Puerto Rico. All of our stores feature the nationally recognized Pep Boys brand name, established through more
than 80 years of providing high-quality automotive merchandise and services, and are company-owned, ensuring chain-wide
consistency for our customers. We are the only national chain offering automotive service, accessories, tires and parts under
one roof, positioning us to achieve our goal of becoming the category dominant one-stop shop for automotive maintenance
and accessories.
Of our 593 stores, 582 are what we refer to as SUPERCENTERS, which feature an average of 11 state-of-the-art service
bays, with an average of more than 20,000 square feet per SUPERCENTER. Our store size allows us to display and sell a more
complete offering of merchandise in a wider array of categories than our competitors, with a focus on the high-growth
accessories segment and a comprehensive tire offering. We leverage this investment in inventory through our ability to install
what we sell in our service bays and by offering this merchandise to both commercial and retail customers.
We had total revenues of $2,235,226,000 and an operating loss of $11,183,000 in fiscal 2005. For the fifty-two weeks
ended January 28, 2006 our comparative sales decreased by 1.3% compared to increases of 6.6% and 1.6% for the fifty-two
weeks ended January 29, 2005 and January 31, 2004, respectively. This decrease in comparable sales was due primarily to a
6.1% decrease in comparable service revenue. Comparable sales were negatively impacted by disruptions: (1) in our stores,
resulting from our recent initiatives designed to improve our long-term performance, such as our store refurbishment program,
a field reorganization into separate retail and service teams and human resources recruiting and training initiatives; and (2) in
the economy, resulting from higher gasoline prices which decreased both our customers’ disposable income and the amount
of miles driven. All stores that are included in the comparable store sales base as of the end of the period are included in the
Company’s comparable store data calculations. Upon reaching its 13th month of operation, a store is added to our comparable
store sales base. Stores are removed from the comparable store sales base upon their relocation or closure. Once a relocated
store reaches its 13th month of operation at its new location, it is added back into our comparable store sales base. Square
footage increases are infrequent and immaterial and, accordingly, are not considered in our calculations of comparable store
data.
During 2005 we increased our total debt by $74,932,000 due to operating losses, investments in inventory, our ongoing
store refurbishment program, repurchases of common equity and costs to refinance company indebtedness. In addition, we
refinanced $183,444,000 of debt and associated costs, which had maturity dates in 2005 and 2006. The above increases in
debt and maturities were financed through the issuance of a $200,000,000 senior secured term loan and our existing credit
facility. Since 1950, we have paid a quarterly cash dividend on an uninterrupted basis, and we are currently paying a dividend
at an annualized rate of $0.27 per share.
During 2005 we reinvested in our existing stores to redesign their interiors and enhance their exterior appeal. Our new
interior design features four distinct merchandising worlds: accessories (fashion, electronic and performance merchandise),
maintenance (hard parts and chemicals), garage (repair shop and travel) and service (including tire, wheel and accessory
installation). We believe that this layout provides customers with a clear and concise way of finding what they need and will
promote cross-selling. In most of our stores, we have moved our service desks and waiting areas inside the retail stores
adjacent to our tire offering displays. Modifications to the exterior of our stores are designed to increase customer traffic.
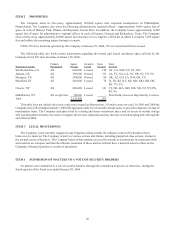
During 2005 we grand reopened 181 stores in the following markets: Los Angeles, CA – 76 (first quarter); Chicago, IL,
and Philadelphia, PA – 69 (second quarter); Harrisburg, PA – 5 (third quarter); Las Vegas, NV, Phoenix, AZ and Tucson, AZ
– 31 (fourth quarter). Over the next three fiscal years we expect to remodel and grand reopen approximately 350 more stores,
as follows: 75-125 stores in fiscal 2006; 125-150 stores in fiscal 2007; and the balance in fiscal 2008.
On the first day of fiscal 2005, the Company separated its field organization into separate Retail and Service organizations.
The restructuring, which allows the Company to hire management employees with industry specific experience in retail or
service, is designed to sharpen the focus on each side of the business thereby improving overall profitability.