Pep Boys 2005 Annual Report Download - page 35
Download and view the complete annual report
Please find page 35 of the 2005 Pep Boys annual report below. You can navigate through the pages in the report by either clicking on the pages listed below, or by using the keyword search tool below to find specific information within the annual report.-
 1
1 -
2
-
3
-
4
-
5
-
6
-
7
-
8
-
9
-
10
-
11
-
12
-
13
-
14
-
15
-
16
-
17
-
18
-
19
-
20
-
21
-
22
-
23
-
24
-
 25
25 -
 26
26 -
 27
27 -
 28
28 -
 29
29 -
 30
30 -
 31
31 -
 32
32 -
 33
33 -
 34
34 -
 35
35 -
 36
36 -
 37
37 -
 38
38 -
 39
39 -
 40
40 -
 41
41 -
 42
42 -
 43
43 -
 44
44 -
 45
45 -
46
-
47
-
48
-
49
-
50
-
51
-
52
-
53
-
54
-
55
-
56
-
57
-
58
-
59
-
60
-
61
-
62
-
63
-
64
-
65
-
66
-
67
-
68
-
69
-
70
-
71
-
72
-
73
-
74
-
75
-
76
-
77
-
78
-
79
-
80
-
81
-
82
-
83
-
84
-
85
-
86
-
87
-
88
-
89
-
90
-
91
-
92
-
93
 |
 |

30
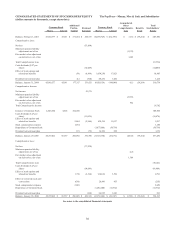
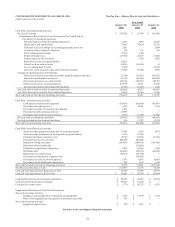
CONSOLIDATED STATEMENTS OF STOCKHOLDERS’EQUITY The Pep Boys—Manny, Moe & Jack and Subsidiaries
(dollar amounts in thousands, except share data)
Common Stock
Shares Amount
Additional
Paid-in-
Capital
Retained
Earnings
Treasury Stock
Shares Amount
Accumulated
Other
Comprehensive
Loss
Benefits
Trust
Total
Stockholders’
Equity
Balance, February 1, 2003 63,910,577 $ 63,911 $ 177,244 $ 586,735 (10,070,729) $ (162,595) $ (151) $ (59,264) $ 605,880
Comprehensive Loss:
Net loss (33,894)
Minimum pension liability
adjustment, net of tax (1,253)
Fair market value adjustment
on derivatives, net of tax 1,389
Total Comprehensive Loss (33,758)
Cash dividends ($.27 per
share) (14,089) (14,089)
Effect of stock options and
related tax benefits (39) (6,499) 1,054,250 17,021 10,483
Dividend reinvestment plan 112 (320) 88,320 1,426 1,218
Balance, January 31, 2004 63,910,577 63,911 177,317 531,933 (8,928,159) (144,148) (15) (59,264) 569,734
Comprehensive Income:
Net income 23,579
Minimum pension liability
adjustment, net of tax (5,799)
Fair market value adjustment
on derivatives, net of tax 962
Total Comprehensive Income 18,742
Issuance of Common Stock 4,646,464 4,646 104,208 108,854
Cash dividends ($.27 per
share) (15,676) (15,676)
Effect of stock options and
related tax benefits 2,064 (2,984) 638,210 10,137 9,217
Stock compensation expense 1,184 1,184
Repurchase of Common Stock (3,077,000) (39,718) (39,718)
Dividend reinvestment plan 193 (72) 61,819 998 1,119
Balance, January 29, 2005 68,557,041 68,557 284,966 536,780 (11,305,130) (172,731) (4,852) (59,264) 653,456
Comprehensive Loss:
Net loss (37,528)
Minimum pension liability
adjustment, net of tax (22)
Fair market value adjustment
on derivatives, net of tax 1,309
Total Comprehensive Loss (36,241)
Cash dividends ($.27 per
share) (14,686) (14,686)
Effect of stock options and
related tax benefits 1,719 (2,520) 338,856 5,592 4,791
Effect of restricted stock unit
conversions (636) 28,981 433 (203)
Stock compensation expense 2,049 2,049
Repurchase of Common Stock (1,282,600) (15,562) (15,562)
Dividend reinvestment plan (120) 66,925 1,081 961
Balance, January 28, 2006 68,557,041 $ 68,557 $ 288,098 $ 481,926 (12,152,968) $ (181,187) $ (3,565) $ (59,264) $ 594,565
See notes to the consolidated financial statements