Pep Boys 2005 Annual Report Download - page 69
Download and view the complete annual report
Please find page 69 of the 2005 Pep Boys annual report below. You can navigate through the pages in the report by either clicking on the pages listed below, or by using the keyword search tool below to find specific information within the annual report.-
 1
1 -
2
-
3
-
4
-
5
-
6
-
7
-
8
-
9
-
10
-
11
-
12
-
13
-
14
-
15
-
16
-
17
-
18
-
19
-
20
-
21
-
22
-
23
-
24
-
25
-
26
-
27
-
28
-
29
-
30
-
31
-
32
-
33
-
34
-
35
-
36
-
37
-
38
-
39
-
40
-
41
-
42
-
43
-
44
-
45
-
46
-
47
-
48
-
49
-
50
-
51
-
52
-
53
-
54
-
55
-
56
-
57
-
58
-
 59
59 -
 60
60 -
 61
61 -
 62
62 -
 63
63 -
 64
64 -
 65
65 -
 66
66 -
 67
67 -
 68
68 -
 69
69 -
 70
70 -
 71
71 -
 72
72 -
 73
73 -
 74
74 -
 75
75 -
 76
76 -
 77
77 -
 78
78 -
 79
79 -
80
-
81
-
82
-
83
-
84
-
85
-
86
-
87
-
88
-
89
-
90
-
91
-
92
-
93
 |
 |

64
THE PEP BOYS—MANNY, MOE & JACK AND SUBSIDIARIES
NOTES TO CONSOLIDATED FINANCIAL STATEMENTS (Continued)
Years ended January 28, 2006, January 29, 2005 and January 31, 2004
(dollar amounts in thousands, except share data)
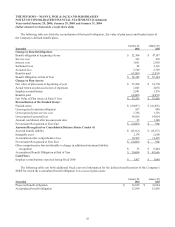
NOTE 18—QUARTERLY FINANCIAL DATA (UNAUDITED)
Year Ended
January 28, 2006
Total
Revenues
Gross
Profit
Operating
(Loss)
Profit
Net
(Loss) Earnings
From
Continuing
Operations
Before
Cumulative
Effect of
Change in
Accounting
Principle
Net
(Loss)
Earnings
Net
(Loss) Earnings Per
Share
From Continuing
Operations Before
Cumulative
Effect of
Change in
Accounting
Principle
Net
(Loss) Earnings
Per Share Cash
Dividends
Per Share
Market
Price Per Share
Basic Diluted Basic Diluted High Low
4th Quarter(1) $549,817 $111,923 $(15,434) $(22,703) $(24,601) $(0.42) $(0.42) $(0.46) $(0.46) $ 0.0675 $15.99 $12.54
3rd Quarter 545,206 118,336 (8,597) (11,410) (11,196) (0.21) (0.21) (0.20) (0.20) 0.0675 14.84 11.75
2nd Quarter 576,688 142,669 9,620 816 1,043 0.01 0.01 0.02 0.02 0.0675 15.24 12.54
1st Quarter 563,515 138,390 3,228 (2,476) (2,774) (0.04) (0.04) (0.05) (0.05) 0.0675 18.80 14.06
Year Ended
January 29, 2005
4th Quarter(2) $553,440 $144,459 $(4,019) $(9,701) $(10,135) $(0.18) $(0.18) $(0.19) $(0.19) $ 0.0675 $17.24 $13.06
3rd Quarter 558,465 149,954 17,552 6,669 6,500 0.12 0.11 0.11 0.11 0.0675 20.70 11.83
2nd Quarter 592,679 165,246 28,753 13,497 12,663 0.23 0.22 0.22 0.21 0.0675 28.10 20.36
1st Quarter 565,390 161,935 32,500 14,990 14,551 0.27 0.25 0.26 0.24 0.0675 29.37 21.29
(1) Includes a pretax charge of $4,200 related to an asset impairment charge reflecting the remaining value of a commercial sales software
asset, which was included in selling, general and administrative expenses.
(2) Includes a pretax charge of $6,911 related to certain executive severance obligations, which was included in selling, general and
administrative expenses, and a pretax gain of $12,695 on the disposal of one of the Company’s distribution centers, which was
included in gross profit from merchandise sales.
Under the Company’s present accounting system, actual gross profit from merchandise sales can be determined only at the
time of physical inventory, which is taken at the end of the fiscal year. Gross profit from merchandise sales for the first, second
and third quarters is estimated by the Company based upon recent historical gross profit experience and other appropriate
factors. Any variation between estimated and actual gross profit from merchandise sales for the first three quarters is reflected
in the fourth quarter’s results.
ITEM 9 CHANGES IN AND DISAGREEMENTS WITH ACCOUNTANTS ON ACCOUNTING AND FINANCIAL
DISCLOSURE
None.
ITEM 9A CONTROLS AND PROCEDURES
Disclosure Controls and Procedures The Company’s management evaluated, with the participation of its principal
executive officer and principal financial officer, the effectiveness of its disclosure controls and procedures as of the end of the
period covered by this report. Based on this evaluation, the Company’s principal executive officer and its principal financial
officer have concluded that, as of the end of the period covered by this report, the Company’s disclosure controls and procedures
were effective. Disclosure controls and procedures mean the Company’s controls and other procedures that are designed to
ensure that information required to be disclosed by the Company in its reports that the Company files or submits under the
Securities Exchange Act of 1934 is recorded, processed, summarized and reported within the time periods specified in the
SEC’s rules and forms. Disclosure controls and procedures include, without limitation, controls and procedures designed to
ensure that information required to be disclosed by the Company in its reports that the Company communicated to its
management, including its principal executive officer and principal financial officer, as appropriate to allow timely decisions
regarding required disclosure.
There have been no changes in the Company’s internal control over financial reporting that occurred during the quarter
ended January 28, 2006 that have materially affected, or are reasonably likely to materially affect, the Company’s internal
control over financial reporting.