Pep Boys 2005 Annual Report Download - page 57
Download and view the complete annual report
Please find page 57 of the 2005 Pep Boys annual report below. You can navigate through the pages in the report by either clicking on the pages listed below, or by using the keyword search tool below to find specific information within the annual report.-
 1
1 -
2
-
3
-
4
-
5
-
6
-
7
-
8
-
9
-
10
-
11
-
12
-
13
-
14
-
15
-
16
-
17
-
18
-
19
-
20
-
21
-
22
-
23
-
24
-
25
-
26
-
27
-
28
-
29
-
30
-
31
-
32
-
33
-
34
-
35
-
36
-
37
-
38
-
39
-
40
-
41
-
42
-
43
-
44
-
45
-
46
-
 47
47 -
 48
48 -
 49
49 -
 50
50 -
 51
51 -
 52
52 -
 53
53 -
 54
54 -
 55
55 -
 56
56 -
 57
57 -
 58
58 -
 59
59 -
 60
60 -
 61
61 -
 62
62 -
 63
63 -
 64
64 -
 65
65 -
 66
66 -
 67
67 -
68
-
69
-
70
-
71
-
72
-
73
-
74
-
75
-
76
-
77
-
78
-
79
-
80
-
81
-
82
-
83
-
84
-
85
-
86
-
87
-
88
-
89
-
90
-
91
-
92
-
93
 |
 |

52
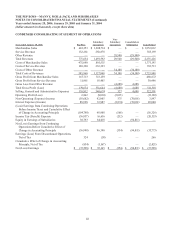
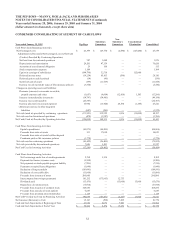
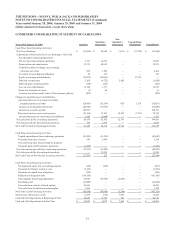
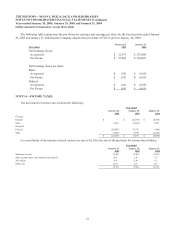
THE PEP BOYS—MANNY, MOE & JACK AND SUBSIDIARIES
NOTES TO CONSOLIDATED FINANCIAL STATEMENTS (Continued)
Years ended January 28, 2006, January 29, 2005 and January 31, 2004
(dollar amounts in thousands, except share data)
CONDENSED CONSOLIDATING STATEMENT OF CASH FLOWS
Year ended January 29, 2005 Pep Boys
Subsidiary
Guarantors
Non-
Subsidiary
Guarantors
Consolidation/
Elimination Consolidated
Cash Flows from Operating Activities:
Net Earnings (Loss) $ 23,579 $ 129,770 $ (2,690) $ (127,080) $ 23,579
Adjustments to Reconcile Net Earnings (Loss) to Net Cash
(Used in) Provided By Continuing Operations:
Net loss from discontinued operations 387 1,489 — — 1,876
Depreciation and amortization 29,261 47,359 — — 76,620
Accretion of asset disposal obligation 29 106 — — 135
Stock compensation expense 1,184 — — — 1,184
Equity in earnings of subsidiaries (144,798) 32,718 — 112,080 —
Deferred income taxes (19,254) 45,835 (398) — 26,183
Deferred gain on sale leaseback (34) (96) — — (130)
Gain from sale of assets (199) (11,649) — — (11,848)
Increase in cash surrender value of life insurance policies (3,540) — — — (3,540)
Changes in operating assets and liabilities:
Decrease (increase) in accounts receivable,
prepaid expenses and other (1,057) (4,604) (12,930) 1,385 (17,206)
Increase in merchandise inventories (14,797) (34,401) — — (49,198)
Increase in accounts payable (24,387) — — — (24,387)
Increase (decrease) in accrued expenses 16,992 (13,920) 25,534 (1,385) 27,221
(Decrease) increase in other long-term
liabilities (887) (385) — — (1,272)
Net cash (used in) provided by continuing operations (137,521) 192,222 9,516 (15,000) 49,217
Net cash used in discontinued operations (479) (3,287) — — (3,766)
Net Cash (Used in) Provided by Operating Activities (138,000) 188,935 9,516 (15,000) 45,451
Cash Flows from Investing Activities:
Capital expenditures (43,975) (44,093) — — (88,068)
Proceeds from sales of assets 331 17,690 — — 18,021
Proceeds from sales of assets held for disposal — — — — —
Premiums paid on life insurance policies (1,778) — — — (1,778)
Net cash used in continuing operations (45,422) (26,403) — — (71,825)
Net cash provided by discontinued operations 7,826 5,501 — — 13,327
Net Cash Used in Investing Activities (37,596) (20,902) — — (58,498)
Cash Flows from Financing Activities:
Net borrowings under line of credit agreements 2,768 5,334 — — 8,102
Payments for finance issuance costs (5,500) — — — (5,500)
Net payments on trade payable program liability (7,216) — — — (7,216)
Payments on capital lease obligations (1,040) — — — (1,040)
Reduction of long-term debt (189,991) — — — (189,991)
Reduction of convertible debt (31,000) — — — (31,000)
Proceeds from issuance of notes 200,000 — — — 200,000
Intercompany borrowings (payments) 161,212 (173,965) 12,753 — —
Dividends paid (15,676) — (15,000) 15,000 (15,676)
Repurchase of common stock (39,718) — — — (39,718)
Proceeds from issuance of common stock 108,854 — — — 108,854
Proceeds from exercise of stock options 6,887 — — — 6,887
Proceeds from dividend reinvestment plan 1,119 — — — 1,119
Net Cash Provided by (Used in) Financing Activities 190,699 (168,631) (2,247) 15,000 34,821
Net Increase (Decrease) in Cash 15,103 (598) 7,269 — 21,774
Cash and Cash Equivalents at Beginning of Year 43,929 9,072 7,983 — 60,984
Cash and Cash Equivalents at End of Year $ 59,032 $ 8,474 $ 15,252 $ — $ 82,758