Pep Boys 2005 Annual Report Download - page 53
Download and view the complete annual report
Please find page 53 of the 2005 Pep Boys annual report below. You can navigate through the pages in the report by either clicking on the pages listed below, or by using the keyword search tool below to find specific information within the annual report.-
 1
1 -
2
-
3
-
4
-
5
-
6
-
7
-
8
-
9
-
10
-
11
-
12
-
13
-
14
-
15
-
16
-
17
-
18
-
19
-
20
-
21
-
22
-
23
-
24
-
25
-
26
-
27
-
28
-
29
-
30
-
31
-
32
-
33
-
34
-
35
-
36
-
37
-
38
-
39
-
40
-
41
-
42
-
 43
43 -
 44
44 -
 45
45 -
 46
46 -
 47
47 -
 48
48 -
 49
49 -
 50
50 -
 51
51 -
 52
52 -
 53
53 -
 54
54 -
 55
55 -
 56
56 -
 57
57 -
 58
58 -
 59
59 -
 60
60 -
 61
61 -
 62
62 -
 63
63 -
64
-
65
-
66
-
67
-
68
-
69
-
70
-
71
-
72
-
73
-
74
-
75
-
76
-
77
-
78
-
79
-
80
-
81
-
82
-
83
-
84
-
85
-
86
-
87
-
88
-
89
-
90
-
91
-
92
-
93
 |
 |

48
THE PEP BOYS—MANNY, MOE & JACK AND SUBSIDIARIES
NOTES TO CONSOLIDATED FINANCIAL STATEMENTS (Continued)
Years ended January 28, 2006, January 29, 2005 and January 31, 2004
(dollar amounts in thousands, except share data)
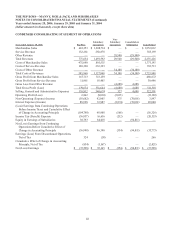
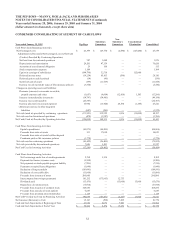
CONDENSED CONSOLIDATING STATEMENT OF OPERATIONS
Year ended January 28, 2006 Pep Boys
Subsidiary
Guarantors
Non-
Subsidiary
Guarantors
Consolidation/
Elimination Consolidated
Merchandise Sales $ 643,353 $ 1,208,714 $ — $ — $ 1,852,067
Service Revenue 132,281 250,878 — — 383,159
Other Revenue — — 29,500 (29,500) —
Total Revenues 775,634 1,459,592 29,500 (29,500) 2,235,226
Costs of Merchandise Sales 475,640 895,555 — — 1,371,195
Costs of Service Revenue 120,320 232,393 — — 352,713
Costs of Other Revenue — — 34,188 (34,188) —
Total Costs of Revenues 595,960 1,127,948 34,188 (34,188) 1,723,908
Gross Profit from Merchandise Sales 167,713 313,159 — — 480,872
Gross Profit from Service Revenue 11,961 18,485 — — 30,446
Gross Loss from Other Revenue — — (4,688) 4,688 —
Total Gross Profit (Loss) 179,674 331,644 (4,688) 4,688 511,318
Selling, General and Administrative Expenses 176,812 340,674 327 4,688 522,501
Operating Profit (Loss) 2,862 (9,030) (5,015) — (11,183)
Non-Operating (Expense) Income (18,682) 92,005 575 (70,001) 3,897
Interest Expense (Income) 88,928 33,987 (3,874) (70,001) 49,040
(Loss) Earnings from Continuing Operations
Before Income Taxes and Cumulative Effect
of Change in Accounting Principle (104,748) 48,988 (566) — (56,326)
Income Tax (Benefit) Expense (36,957) 16,616 (212) — (20,553)
Equity in Earnings of Subsidiaries 30,793 64,018 — (94,811) —
Net (Loss) Earnings from Continuing
Operations Before Cumulative Effect of
Change in Accounting Principle (36,998) 96,390 (354) (94,811) (35,773)
Earnings (Loss) From Discontinued Operations,
Net of Tax 324 (58) — — 266
Cumulative Effect of Change in Accounting
Principle, Net of Tax (854) (1,167) — — (2,021)
Net (Loss) Earnings $ (37,528) $ 95,165 $ (354) $ (94,811) $ (37,528)