Pep Boys 2005 Annual Report Download - page 40
Download and view the complete annual report
Please find page 40 of the 2005 Pep Boys annual report below. You can navigate through the pages in the report by either clicking on the pages listed below, or by using the keyword search tool below to find specific information within the annual report.-
 1
1 -
2
-
3
-
4
-
5
-
6
-
7
-
8
-
9
-
10
-
11
-
12
-
13
-
14
-
15
-
16
-
17
-
18
-
19
-
20
-
21
-
22
-
23
-
24
-
25
-
26
-
27
-
28
-
29
-
 30
30 -
 31
31 -
 32
32 -
 33
33 -
 34
34 -
 35
35 -
 36
36 -
 37
37 -
 38
38 -
 39
39 -
 40
40 -
 41
41 -
 42
42 -
 43
43 -
 44
44 -
 45
45 -
 46
46 -
 47
47 -
 48
48 -
 49
49 -
 50
50 -
51
-
52
-
53
-
54
-
55
-
56
-
57
-
58
-
59
-
60
-
61
-
62
-
63
-
64
-
65
-
66
-
67
-
68
-
69
-
70
-
71
-
72
-
73
-
74
-
75
-
76
-
77
-
78
-
79
-
80
-
81
-
82
-
83
-
84
-
85
-
86
-
87
-
88
-
89
-
90
-
91
-
92
-
93
 |
 |

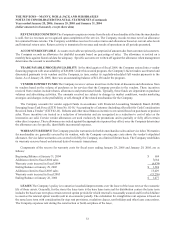
35
THE PEP BOYS—MANNY, MOE & JACK AND SUBSIDIARIES
NOTES TO CONSOLIDATED FINANCIAL STATEMENTS (Continued)
Years ended January 28, 2006, January 29, 2005 and January 31, 2004
(dollar amounts in thousands, except share data)
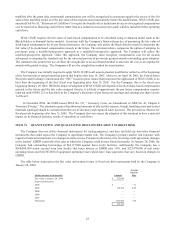
During the second quarter of fiscal 2003, the Company, as a result of its ongoing review of the performance of its stores,
identified certain stores whose cash flow trend indicated that their carrying value may not be fully recoverable. An impairment
charge of $1,371 was recorded for these stores in costs of merchandise sales on the consolidated statement of operations. The
charge reflects the difference between these stores’ carrying value and fair value. Fair value was based on sales of similar
assets or other estimates of fair value developed by Company management. Management’s judgment is necessary to estimate
fair value. Accordingly, actual results could vary from such estimates.
In November 2001, the Company began developing a fully integrated point-of-sale information system for all of its stores.
Due to concerns about the ability of the base software’s architecture to support a chain-wide roll-out, the Company decided
to identify an alternative base software as the basis for our customized system. Consequently, the Company took a $13,164
impairment charge against a portion of the system’s assets in fiscal 2003. This charge was recorded in selling, general and
administrative expenses on the consolidated statement of operations.
EARNINGS PER SHARE Earnings per share for all periods have been computed in accordance with SFAS No. 128,
“Earnings Per Share.” Basic earnings per share is computed by dividing earnings by the weighted average number of common
shares outstanding during the year. Diluted earnings per share is computed by dividing earnings plus the interest on the
convertible senior notes by the weighted average number of common shares outstanding during the year plus the assumed
conversion of dilutive convertible debt and incremental shares that would have been outstanding upon the assumed exercise
of dilutive stock options.
ACCOUNTING FOR STOCK-BASED COMPENSATION At January 28, 2006, the Company has three stock-based
employee compensation plans, which are described in full in Note 12, “Equity Compensation Plans.” The Company accounts
for those plans under the recognition and measurement principles of Accounting Principles Board (APB) Opinion No. 25,
“Accounting for Stock Issued to Employees” (APB 25) and related interpretations. No employee compensation cost is reflected
in net earnings (loss), as all stock options granted under those plans had an exercise price equal to the market value of the
underlying common stock on the date of grant.
In the first quarter of fiscal 2004, the Company began to issue restricted stock unit awards (RSU’s) to certain employees.
The employee compensation cost was $2,049 and $1,184 for the years ended January 28, 2006 and January 29, 2005,
respectively, and is reflected in net earnings (loss) based on the stock value on the grant date over the vesting period.
The following table illustrates the effect on net earnings and earnings per share if the Company had applied the fair value
recognition provisions of SFAS No. 123, “Accounting for Stock-Based Compensation,” to stock-based employee
compensation:
Year ended
January 28,
2006
January 29,
2005
January 31,
2004
Net (loss) earnings:
As reported $ (37,528) $ 23,579 $ (33,894)
Add: Stock-based compensation for RSU’s, net of tax 1,301 741 —
Less: Total stock-based compensation expense determined under fair value-based
method, net of tax (3,121) (2,858) (2,839)
Pro forma $ (39,348) $ 21,462 $ (36,733)
Net earnings (loss) per share:
Basic:
As reported $ (0.69) $ 0.42 $ (0.65)
Pro forma $ (0.72) $ 0.38 $ (0.70)
Diluted:
As reported $ (0.69) $ 0.41 $ (0.65)
Pro forma $ (0.72) $ 0.38 $ (0.70)