Pep Boys 2005 Annual Report Download - page 54
Download and view the complete annual report
Please find page 54 of the 2005 Pep Boys annual report below. You can navigate through the pages in the report by either clicking on the pages listed below, or by using the keyword search tool below to find specific information within the annual report.-
 1
1 -
2
-
3
-
4
-
5
-
6
-
7
-
8
-
9
-
10
-
11
-
12
-
13
-
14
-
15
-
16
-
17
-
18
-
19
-
20
-
21
-
22
-
23
-
24
-
25
-
26
-
27
-
28
-
29
-
30
-
31
-
32
-
33
-
34
-
35
-
36
-
37
-
38
-
39
-
40
-
41
-
42
-
43
-
 44
44 -
 45
45 -
 46
46 -
 47
47 -
 48
48 -
 49
49 -
 50
50 -
 51
51 -
 52
52 -
 53
53 -
 54
54 -
 55
55 -
 56
56 -
 57
57 -
 58
58 -
 59
59 -
 60
60 -
 61
61 -
 62
62 -
 63
63 -
 64
64 -
65
-
66
-
67
-
68
-
69
-
70
-
71
-
72
-
73
-
74
-
75
-
76
-
77
-
78
-
79
-
80
-
81
-
82
-
83
-
84
-
85
-
86
-
87
-
88
-
89
-
90
-
91
-
92
-
93
 |
 |

49
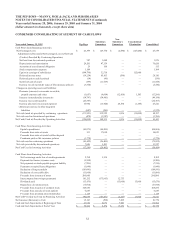
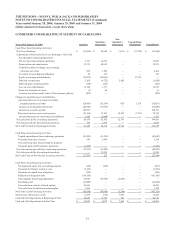
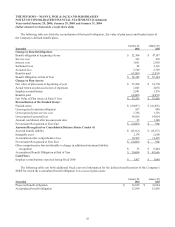
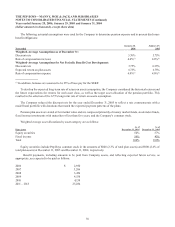
THE PEP BOYS—MANNY, MOE & JACK AND SUBSIDIARIES
NOTES TO CONSOLIDATED FINANCIAL STATEMENTS (Continued)
Years ended January 28, 2006, January 29, 2005 and January 31, 2004
(dollar amounts in thousands, except share data)
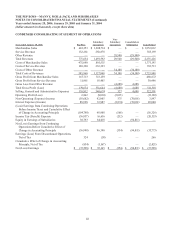
CONDENSED CONSOLIDATING STATEMENT OF OPERATIONS
Year ended January 29, 2005 Pep Boys
Subsidiary
Guarantors
Non-
Subsidiary
Guarantors
Consolidation/
Elimination Consolidated
Merchandise Sales $ 647,135 $ 1,213,493 $ — $ — $ 1,860,628
Service Revenue 141,915 267,431 — — 409,346
Other Revenue — — 28,432 (28,432) —
Total Revenues 789,050 1,480,924 28,432 (28,432) 2,269,974
Costs of Merchandise Sales 469,421 862,307 — — 1,331,728
Costs of Service Revenue 108,554 208,098 — — 316,652
Costs of Other Revenue — — 35,693 (35,693) —
Total Costs of Revenues 577,975 1,070,405 35,693 (35,693) 1,648,380
Gross Profit from Merchandise Sales 177,714 351,186 — — 528,900
Gross Profit from Service Revenue 33,361 59,333 — — 92,694
Gross Loss from Other Revenue — — (7,261) 7,261 —
Total Gross Profit (Loss) 211,075 410,519 (7,261) 7,261 621,594
Selling, General and Administrative Expenses 189,161 350,070 316 7,261 546,808
Operating Profit (Loss) 21,914 60,449 (7,577) — 74,786
Non-Operating (Expense) Income (18,317) 71,679 3,397 (54,935) 1,824
Interest Expense 64,268 26,632 — (54,935) 35,965
Earnings (Loss) from Continuing Operations
Before Income Taxes (60,671) 105,496 (4,180) — 40,645
Income Tax (Benefit) Expense (22,515) 39,195 (1,490) — 15,190
Equity in Earnings of Subsidiaries 62,122 64,958 — (127,080) —
Net Earnings (Loss) from Continuing Operations 23,966 131,259 (2,690) (127,080) 25,455
Loss from Discontinued Operations, Net of Tax (387) (1,489) — — (1,876)
Net Earnings (Loss) $ 23,579 $ 129,770 $ (2,690) $ (127,080) $ 23,579