Pep Boys 2005 Annual Report Download - page 51
Download and view the complete annual report
Please find page 51 of the 2005 Pep Boys annual report below. You can navigate through the pages in the report by either clicking on the pages listed below, or by using the keyword search tool below to find specific information within the annual report.-
 1
1 -
2
-
3
-
4
-
5
-
6
-
7
-
8
-
9
-
10
-
11
-
12
-
13
-
14
-
15
-
16
-
17
-
18
-
19
-
20
-
21
-
22
-
23
-
24
-
25
-
26
-
27
-
28
-
29
-
30
-
31
-
32
-
33
-
34
-
35
-
36
-
37
-
38
-
39
-
40
-
 41
41 -
 42
42 -
 43
43 -
 44
44 -
 45
45 -
 46
46 -
 47
47 -
 48
48 -
 49
49 -
 50
50 -
 51
51 -
 52
52 -
 53
53 -
 54
54 -
 55
55 -
 56
56 -
 57
57 -
 58
58 -
 59
59 -
 60
60 -
 61
61 -
62
-
63
-
64
-
65
-
66
-
67
-
68
-
69
-
70
-
71
-
72
-
73
-
74
-
75
-
76
-
77
-
78
-
79
-
80
-
81
-
82
-
83
-
84
-
85
-
86
-
87
-
88
-
89
-
90
-
91
-
92
-
93
 |
 |

46
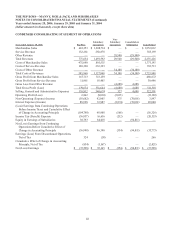
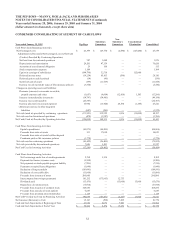
THE PEP BOYS—MANNY, MOE & JACK AND SUBSIDIARIES
NOTES TO CONSOLIDATED FINANCIAL STATEMENTS (Continued)
Years ended January 28, 2006, January 29, 2005 and January 31, 2004
(dollar amounts in thousands, except share data)
CONDENSED CONSOLIDATING BALANCE SHEET
As of January 28, 2006 Pep Boys
Subsidiary
Guarantors
Non-
Subsidiary
Guarantors
Consolidation/
Elimination Consolidated
ASSETS
Current Assets:
Cash and cash equivalents $ 12,019 $ 6,953 $ 29,309 $ — $ 48,281
Accounts receivable, net 20,030 16,404 — — 36,434
Merchandise inventories 209,384 406,908 — — 616,292
Prepaid expenses 33,765 9,678 19,000 (21,491) 40,952
Other 6,116 8,960 70,370 — 85,446
Assets held for disposal — 652 — — 652
Total Current Assets 281,314 449,555 118,679 (21,491) 828,057
Property and Equipment—at cost:
Land 86,805 170,997 — — 257,802
Buildings and improvements 316,725 599,855 — — 916,580
Furniture, fixtures and equipment 278,742 392,447 — — 671,189
Construction in progress 15,261 597 — — 15,858
697,533 1,163,896 — — 1,861,429
Less accumulated depreciation and
amortization 364,793 549,247 — — 914,040
Total Property and Equipment—Net 332,740 614,649 — — 947,389
Investment in subsidiaries 1,520,208 1,290,063 — (2,810,271) —
Intercompany receivable — 631,061 84,563 (715,624) —
Other 42,144 3,723 — 440 46,307
Total Assets $ 2,176,406 $ 2,989,051 $ 203,242 $ (3,546,946) $ 1,821,753
LIABILITIES AND STOCKHOLDERS’
EQUITY
Current Liabilities:
Accounts payable $ 261,931$ 9$ —$ —$ 261,940
Trade payable program liability 11,156 11,156
Accrued expenses 45,410 90,428 195,472 (40,549) 290,761
Current deferred taxes 64 21,690 (6,337) — 15,417
Current maturities of long-term debt and
obligations under capital leases 1,257 — — — 1,257
Total Current Liabilities 319,818 112,127 189,135 (40,549) 580,531
Long-term debt and obligations under capital
leases, less current maturities 423,572 43,667 — — 467,239
Convertible long-term debt, less current
maturities 119,000 — — — 119,000
Other long-term liabilities 9,625 28,359 — 19,497 57,481
Intercompany liabilities 716,978 (1,353) — (715,625) —
Deferred income taxes (7,152) 10,089 — — 2,937
Stockholders’ Equity:
Common stock 68,557 1,502 100 (1,602) 68,557
Additional paid-in capital 288,098 436,858 3,900 (440,758) 288,098
Retained earnings 481,926 2,357,802 10,107 (2,367,909) 481,926
Accumulated other comprehensive loss (3,565) — — — (3,565)
Less:
Cost of shares in treasury 181,187 — — — 181,187
Cost of shares in benefits trust 59,264 — — — 59,264
Total Stockholders’ Equity 594,565 2,796,162 14,107 (2,810,269) 594,565
Total Liabilities and Stockholders’ Equity $ 2,176,406 $ 2,989,051 $ 203,242 $ (3,546,946) $ 1,821,753