Pep Boys 2005 Annual Report Download - page 34
Download and view the complete annual report
Please find page 34 of the 2005 Pep Boys annual report below. You can navigate through the pages in the report by either clicking on the pages listed below, or by using the keyword search tool below to find specific information within the annual report.-
 1
1 -
2
-
3
-
4
-
5
-
6
-
7
-
8
-
9
-
10
-
11
-
12
-
13
-
14
-
15
-
16
-
17
-
18
-
19
-
20
-
21
-
22
-
23
-
 24
24 -
 25
25 -
 26
26 -
 27
27 -
 28
28 -
 29
29 -
 30
30 -
 31
31 -
 32
32 -
 33
33 -
 34
34 -
 35
35 -
 36
36 -
 37
37 -
 38
38 -
 39
39 -
 40
40 -
 41
41 -
 42
42 -
 43
43 -
 44
44 -
45
-
46
-
47
-
48
-
49
-
50
-
51
-
52
-
53
-
54
-
55
-
56
-
57
-
58
-
59
-
60
-
61
-
62
-
63
-
64
-
65
-
66
-
67
-
68
-
69
-
70
-
71
-
72
-
73
-
74
-
75
-
76
-
77
-
78
-
79
-
80
-
81
-
82
-
83
-
84
-
85
-
86
-
87
-
88
-
89
-
90
-
91
-
92
-
93
 |
 |

29
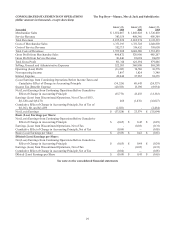
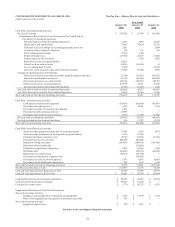
CONSOLIDATED STATEMENTS OF OPERATIONS The Pep Boys—Manny, Moe & Jack and Subsidiaries
(dollar amounts in thousands, except share data)
Year ended
January 28,
2006
January 29,
2005
January 31,
2004
Merchandise Sales $ 1,852,067 $ 1,860,628 $ 1,726,010
Service Revenue 383,159 409,346 405,309
Total Revenues 2,235,226 2,269,974 2,131,319
Costs of Merchandise Sales 1,371,195 1,331,728 1,240,803
Costs of Service Revenue 352,713 316,652 310,650
Total Costs of Revenues 1,723,908 1,648,380 1,551,453
Gross Profit from Merchandise Sales 480,872 528,900 485,207
Gross Profit from Service Revenue 30,446 92,694 94,659
Total Gross Profit 511,318 621,594 579,866
Selling, General and Administrative Expenses 522,501 546,808 569,288
Operating (Loss) Profit (11,183) 74,786 10,578
Non-operating Income 3,897 1,824 3,340
Interest Expense 49,040 35,965 38,255
(Loss) Earnings from Continuing Operations Before Income Taxes and
Cumulative Effect of Change in Accounting Principle (56,326) 40,645 (24,337)
Income Tax (Benefit) Expense (20,553) 15,190 (8,954)
Net (Loss) Earnings from Continuing Operations Before Cumulative
Effect of Change in Accounting Principle (35,773) 25,455 (15,383)
Earnings (Loss) from Discontinued Operations, Net of Tax of $153,
$(1,120) and $(9,272) 266 (1,876) (16,027)
Cumulative Effect of Change in Accounting Principle, Net of Tax of
$(1,161), $0, and $(1,459) (2,021) - (2,484)
Net (Loss) Earnings $ (37,528) $ 23,579 $ (33,894)
Basic (Loss) Earnings per Share:
Net (Loss) Earnings from Continuing Operations Before Cumulative
Effect of Change in Accounting Principle $ (0.65) $ 0.45 $ (0.29)
Earnings (Loss) from Discontinued Operations, Net of Tax - (0.03) (0.31)
Cumulative Effect of Change in Accounting Principle, Net of Tax (0.04) — (0.05)
Basic (Loss) Earnings per Share $ (0.69) $ 0.42 $ (0.65)
Diluted (Loss) Earnings per Share:
Net (Loss) Earnings from Continuing Operations Before Cumulative
Effect of Change in Accounting Principle $ (0.65) $ 0.44 $ (0.29)
Earnings (Loss) from Discontinued Operations, Net of Tax - (0.03) (0.31)
Cumulative Effect of Change in Accounting Principle, Net of Tax (0.04) — (0.05)
Diluted (Loss) Earnings per Share $ (0.69) $ 0.41 $ (0.65)
See notes to the consolidated financial statements