Pep Boys 2005 Annual Report Download - page 19
Download and view the complete annual report
Please find page 19 of the 2005 Pep Boys annual report below. You can navigate through the pages in the report by either clicking on the pages listed below, or by using the keyword search tool below to find specific information within the annual report.-
 1
1 -
2
-
3
-
4
-
5
-
6
-
7
-
8
-
 9
9 -
 10
10 -
 11
11 -
 12
12 -
 13
13 -
 14
14 -
 15
15 -
 16
16 -
 17
17 -
 18
18 -
 19
19 -
 20
20 -
 21
21 -
 22
22 -
 23
23 -
 24
24 -
 25
25 -
 26
26 -
 27
27 -
 28
28 -
 29
29 -
30
-
31
-
32
-
33
-
34
-
35
-
36
-
37
-
38
-
39
-
40
-
41
-
42
-
43
-
44
-
45
-
46
-
47
-
48
-
49
-
50
-
51
-
52
-
53
-
54
-
55
-
56
-
57
-
58
-
59
-
60
-
61
-
62
-
63
-
64
-
65
-
66
-
67
-
68
-
69
-
70
-
71
-
72
-
73
-
74
-
75
-
76
-
77
-
78
-
79
-
80
-
81
-
82
-
83
-
84
-
85
-
86
-
87
-
88
-
89
-
90
-
91
-
92
-
93
 |
 |
14
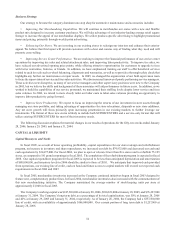
Business Strategy
Our strategy to become the category dominant one-stop shop for automotive maintenance and accessories includes:
• Improving Our Merchandising Capabilities. We will continue to merchandise our stores with a new and flexible
product mix designed to increase customer purchases. We will take advantage of our industry-leading average retail square
footage to increase the appeal of our merchandise displays. We utilize product-specific advertising to highlight promotional
items and pricing, primarily through weekly print advertising.
• Enhancing Our Stores. We are investing in our existing stores to redesign our interiors and enhance their exterior
appeal. We believe that this layout will provide customers with a clear and concise way of finding what they need and will
promote cross-selling.
• Improving Service Center Performance. We are working to improve the financial performance of our service center
operations by improving tire sales and related attachment sales, and improving labor productivity. To improve tire sales, we
have reduced our advertised opening price points, while offering attractive opportunities for customers to upgrade to tires
with better warranties, features, or brands. In addition, we have emphasized training our staff to offer beneficial services
related to each tire sale such as wheel balancing, alignments and warranties, as well as to provide a thorough safety check that
highlights any further car maintenance or repair needs. In 2005, we changed the organization of our field supervision team
to focus the supervision of service and tires sales activities. We also increased turnover of poorly performing service managers.
These activities were disruptive, as many of our service managers and other supervisory positions were new to the Company
in 2005, but we believe the skills and background of these associates will aid performance in future years. In addition, as we
worked to build the capabilities of our service personnel, we maintained their staffing levels despite lower service and tires
sales volumes. In 2006, we intend to more closely tailor our labor costs to labor sales volumes providing an opportunity to
improve labor productivity going forward.
• Improve Store Productivity. We expect to focus on improving the returns of our investment in store assets through
managing our store portfolio, and taking advantage of opportunities for store relocations, disposals or new store additions.
Any net store growth will focus primarily upon increasing penetration in our existing markets to further leverage our
investments. The format of these new stores is likely to include both SUPERCENTERS and a service-only format that will
utilize existing SUPERCENTERS for most of their inventory needs.
The following discussion explains the material changes in our results of operations for the fifty-two weeks ended January
28, 2006, January 29, 2005, and January 31, 2004.
CAPITAL & LIQUIDITY
Capital Resources and Needs
In fiscal 2005, as a result of lower operating profitability, capital expenditures for our store redesign and refurbishment
program, an increase in inventory and share repurchases, we increased our debt by $74,932,000 and decreased our cash and
cash equivalents by $34,477,000. For fiscal 2006, we plan to open or relocate fewer than five stores and to refurbish 75-125
stores, as compared to 181 grand reopenings in fiscal 2005. The completion of the refurbishment program is expected in fiscal
2008. Our capital expenditure program for fiscal 2006 is expected to be less than anticipated depreciation and amortization
of $80,000,000, and inventory levels in 2006 should be similar to those of 2005. We anticipate that improved cash provided
from operations, our existing line of credit, cash on hand and future access to capital markets will exceed our expected cash
requirements in fiscal 2006 and 2007.
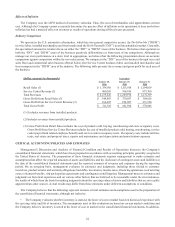
In fiscal 2005, merchandise inventories increased as the Company continued initiatives begun in fiscal 2003 designed to
feature new, complementary product lines. In fiscal 2004, merchandise inventories also increased with the commencement of
this new merchandising initiative. The Company maintained the average number of stock-keeping units per store at
approximately 23,000 in fiscal 2005.
The Company’s working capital was $247,526,000 at January 28, 2006, $180,651,000 at January 29, 2005, and $76,227,000
at January 31, 2004. The Company’s long-term debt, as a percentage of its total capitalization, was 50% at January 28, 2006
and 42% at January 29, 2005 and January 31, 2004, respectively. As of January 28, 2006, the Company had a $357,500,000
line of credit, with an availability of approximately $166,000,000. Our current portion of long term debt is $1,257,000 at
January 28, 2006.