Pep Boys 2005 Annual Report Download - page 52
Download and view the complete annual report
Please find page 52 of the 2005 Pep Boys annual report below. You can navigate through the pages in the report by either clicking on the pages listed below, or by using the keyword search tool below to find specific information within the annual report.-
 1
1 -
2
-
3
-
4
-
5
-
6
-
7
-
8
-
9
-
10
-
11
-
12
-
13
-
14
-
15
-
16
-
17
-
18
-
19
-
20
-
21
-
22
-
23
-
24
-
25
-
26
-
27
-
28
-
29
-
30
-
31
-
32
-
33
-
34
-
35
-
36
-
37
-
38
-
39
-
40
-
41
-
 42
42 -
 43
43 -
 44
44 -
 45
45 -
 46
46 -
 47
47 -
 48
48 -
 49
49 -
 50
50 -
 51
51 -
 52
52 -
 53
53 -
 54
54 -
 55
55 -
 56
56 -
 57
57 -
 58
58 -
 59
59 -
 60
60 -
 61
61 -
 62
62 -
63
-
64
-
65
-
66
-
67
-
68
-
69
-
70
-
71
-
72
-
73
-
74
-
75
-
76
-
77
-
78
-
79
-
80
-
81
-
82
-
83
-
84
-
85
-
86
-
87
-
88
-
89
-
90
-
91
-
92
-
93
 |
 |

47
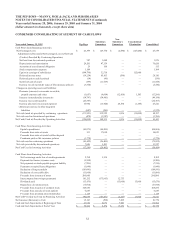
THE PEP BOYS—MANNY, MOE & JACK AND SUBSIDIARIES
NOTES TO CONSOLIDATED FINANCIAL STATEMENTS (Continued)
Years ended January 28, 2006, January 29, 2005 and January 31, 2004
(dollar amounts in thousands, except share data)
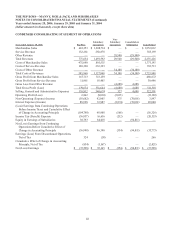
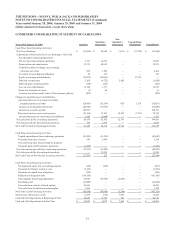
CONDENSED CONSOLIDATING BALANCE SHEET
As of January 29, 2005 Pep Boys
Subsidiary
Guarantors
Non-
Subsidiary
Guarantors
Consolidation/
Elimination Consolidated
ASSETS
Current Assets:
Cash and cash equivalents $ 59,032 $ 8,474 $ 15,252 $ — $ 82,758
Accounts receivable, net 14,150 16,844 — — 30,994
Merchandise inventories 205,908 396,852 — — 602,760
Prepaid expenses 28,535 17,450 21,499 (22,135) 45,349
Deferred income taxes 3,140 (28,192) 5,645 19,407 —
Other 19,170 12,097 64,798 — 96,065
Assets held for disposal — 665 — — 665
Total Current Assets 329,935 424,190 107,194 (2,728) 858,591
Property and Equipment—at cost:
Land 87,314 174,671 — — 261,985
Buildings and improvements 315,170 600,929 — — 916,099
Furniture, fixtures and equipment 296,732 336,366 — — 633,098
Construction in progress 38,240 2,186 — — 40,426
737,456 1,114,152 — — 1,851,608
Less accumulated depreciation and amortization 390,331 516,246 — — 906,577
Total Property and Equipment—Net 347,125 597,906 — — 945,031
Investment in subsidiaries 1,585,211 1,130,247 — (2,715,458)
Intercompany receivable — 845,384 85,881 (931,265) —
Other 59,900 3,501 — — 63,401
Total Assets $ 2,322,171 $ 3,001,228 $ 193,075 $ (3,649,451) $ 1,867,023
LIABILITIES AND STOCKHOLDERS’
EQUITY
Current Liabilities:
Accounts payable $ 310,972$ 9$ —$ —$ 310,981
Trade payable program liability — — — — —
Accrued expenses 60,178 90,014 178,614 (22,135) 306,671
Current deferred taxes — — — 19,406 19,406
Current maturities of long-term debt and
obligations under capital leases 40,882 — — — 40,882
Total Current Liabilities 412,032 90,023 178,614 (2,729) 677,940
Long-term debt and obligations under capital
leases, less current maturities 347,315 5,367 — — 352,682
Convertible long-term debt, less current maturities 119,000 — — — 119,000
Other long-term liabilities 11,416 26,561 — — 37,977
Intercompany liabilities 765,068 166,196 — (931,264) —
Deferred income taxes 13,884 12,084 — — 25,968
Stockholders’ Equity:
Common stock 68,557 1,502 100 (1,602) 68,557
Additional paid-in capital 284,966 436,858 3,900 (440,758) 284,966
Retained earnings 536,780 2,262,637 10,461 (2,273,098) 536,780
Accumulated other comprehensive loss (4,852) — — — (4,852)
Less:
Cost of shares in treasury 172,731 — — — 172,731
Cost of shares in benefits trust 59,264 — — — 59,264
Total Stockholders’ Equity 653,456 2,700,997 14,461 (2,715,458) 653,456
Total Liabilities and Stockholders’ Equity $ 2,322,171 $ 3,001,228 $ 193,075 $ (3,649,451) $ 1,867,023