Pep Boys 2005 Annual Report Download - page 36
Download and view the complete annual report
Please find page 36 of the 2005 Pep Boys annual report below. You can navigate through the pages in the report by either clicking on the pages listed below, or by using the keyword search tool below to find specific information within the annual report.-
 1
1 -
2
-
3
-
4
-
5
-
6
-
7
-
8
-
9
-
10
-
11
-
12
-
13
-
14
-
15
-
16
-
17
-
18
-
19
-
20
-
21
-
22
-
23
-
24
-
25
-
 26
26 -
 27
27 -
 28
28 -
 29
29 -
 30
30 -
 31
31 -
 32
32 -
 33
33 -
 34
34 -
 35
35 -
 36
36 -
 37
37 -
 38
38 -
 39
39 -
 40
40 -
 41
41 -
 42
42 -
 43
43 -
 44
44 -
 45
45 -
 46
46 -
47
-
48
-
49
-
50
-
51
-
52
-
53
-
54
-
55
-
56
-
57
-
58
-
59
-
60
-
61
-
62
-
63
-
64
-
65
-
66
-
67
-
68
-
69
-
70
-
71
-
72
-
73
-
74
-
75
-
76
-
77
-
78
-
79
-
80
-
81
-
82
-
83
-
84
-
85
-
86
-
87
-
88
-
89
-
90
-
91
-
92
-
93
 |
 |

31
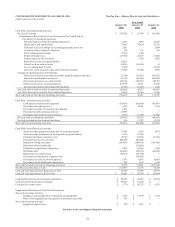
CONSOLIDATED STATEMENTS OF CASH FLOWS The Pep Boys—Manny, Moe & Jack and Subsidiaries
(dollar amounts in thousands)
Year ended
January 28,
2006
January 29,
2005
January 31,
2004
Cash Flows from Operating Activities:
Net (Loss) Earnings $ (37,528) $ 23,579 $ (33,894)
Adjustments to Reconcile Net (Loss) Earnings to Net Cash (Used in)
Provided by Continuing Operations:
Net (earnings) loss from discontinued operations (266) 1,876 16,027
Depreciation and amortization 79,887 76,620 78,275
Cumulative effect of change in accounting principle, net of tax 2,021 — 2,484
Accretion of asset disposal obligation 109 135 163
Stock compensation expense 2,049 1,184 —
Deferred income taxes (27,792) 26,183 (1,402)
Deferred gain on sale leaseback — (130) (425)
Reduction in asset retirement liability (1,815) — —
(Gain) loss from sales of assets (4,826) (11,848) 61
Loss on impairment of assets 4,200 — 14,535
Increase in cash surrender value of life insurance policies (3,389) (3,540) (478)
Changes in operating assets and liabilities:
Decrease (increase) in accounts receivable, prepaid expenses and other 15,166 (17,206) (30,827)
Increase in merchandise inventories (13,532) (49,198) (64,680)
(Decrease) increase in accounts payable (49,041) (24,387) 142,531
(Decrease) increase in accrued expenses (18,864) 27,221 25,765
Increase (decrease) in other long-term liabilities 16,760 (1,272) 1,726
Net Cash (Used in) Provided by Continuing Operations (36,861) 49,217 149,861
Net Cash (Used in) Provided by Discontinued Operations (1,526) (3,766) 2,686
Net Cash (Used in) Provided by Operating Activities (38,387) 45,451 152,547
Cash Flows from Investing Activities:
Cash paid for property and equipment (85,945) (88,068) (41,847)
Proceeds from sales of assets 4,043 18,021 3,316
Proceeds from sales of assets held for disposal 6,913 — —
Proceeds from life insurance policies 24,655 — —
Premiums paid on life insurance policies (605) (1,778) (1,892)
Net cash used in continuing operations (50,939) (71,825) (40,423)
Net cash provided by discontinued operations 916 13,327 13,214
Net Cash Used in Investing Activities (50,023) (58,498) (27,209)
Cash Flows from Financing Activities:
Net borrowings (payments) under line of credit agreements 57,985 8,102 (497)
Net borrowings (payments) on trade payable program liability 11,156 (7,216) —
Payments for finance issuance costs (5,150) (5,500) (2,356)
Proceeds from issuance of notes 200,000 200,000 —
Reduction of long-term debt (183,459) (189,991) (101,183)
Reduction of convertible debt — (31,000) —
Payments on capital lease obligations (383) (1,040) (700)
Dividends paid (14,686) (15,676) (14,089)
Repurchase of common stock (15,562) (39,718) —
Proceeds from issuance of common stock — 108,854 —
Proceeds from exercise of stock options 3,071 6,887 10,483
Proceeds from dividend reinvestment plan 961 1,119 1,218
Net Cash Provided by (Used in) Financing Activities 53,933 34,821 (107,124)
Net (Decrease) Increase in Cash (34,477) 21,774 18,214
Cash and Cash Equivalents at Beginning of Year 82,758 60,984 42,770
Cash and Cash Equivalents at End of Year $ 48,281 $ 82,758 $ 60,984
Cash paid for interest, net of amounts capitalized $ 50,602 $ 30,019 $ 35,048
Cash received from income tax refunds $ 10,097 $ 23,290 $ —
Cash paid for income taxes $ 1,770 $ 48,732 $ 6,553
Supplemental Disclosure of Cash Flow Information:
Non-cash investing activities:
Changes in accrued purchases of property and equipment $ 6,138 $ 15,698 $ 1,415
Write off of equipment and recognition of insurance receivable $ 345 $ — $ —
Non-cash financing activities:
Equipment capital leases $ 789 $ 1,413 $ —
See notes to the consolidated financial statements