Oracle 2015 Annual Report Download - page 91
Download and view the complete annual report
Please find page 91 of the 2015 Oracle annual report below. You can navigate through the pages in the report by either clicking on the pages listed below, or by using the keyword search tool below to find specific information within the annual report.-
 1
1 -
2
-
3
-
4
-
5
-
6
-
7
-
8
-
9
-
10
-
11
-
12
-
13
-
14
-
15
-
16
-
17
-
18
-
19
-
20
-
21
-
22
-
23
-
24
-
25
-
26
-
27
-
28
-
29
-
30
-
31
-
32
-
33
-
34
-
35
-
36
-
37
-
38
-
39
-
40
-
41
-
42
-
43
-
44
-
45
-
46
-
47
-
48
-
49
-
50
-
51
-
52
-
53
-
54
-
55
-
56
-
57
-
58
-
59
-
60
-
61
-
62
-
63
-
64
-
65
-
66
-
67
-
68
-
69
-
70
-
71
-
72
-
73
-
74
-
75
-
76
-
77
-
78
-
79
-
80
-
 81
81 -
 82
82 -
 83
83 -
 84
84 -
 85
85 -
 86
86 -
 87
87 -
 88
88 -
 89
89 -
 90
90 -
 91
91 -
 92
92 -
 93
93 -
 94
94 -
 95
95 -
 96
96 -
 97
97 -
 98
98 -
 99
99 -
 100
100 -
 101
101 -
102
-
103
-
104
-
105
-
106
-
107
-
108
-
109
-
110
-
111
-
112
-
113
-
114
-
115
-
116
-
117
-
118
-
119
-
120
-
121
-
122
-
123
-
124
-
125
-
126
-
127
-
128
-
129
-
130
-
131
-
132
-
133
-
134
-
135
-
136
-
137
-
138
-
139
-
140
-
141
-
142
-
143
-
144
-
145
-
146
-
147
-
148
-
149
-
150
-
151
-
152
-
153
-
154
-
155
 |
 |

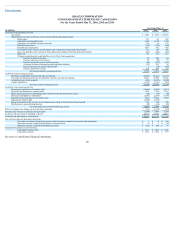
Table of Contents
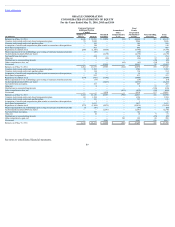
ORACLE CORPORATION
CONSOLIDATED STATEMENTS OF EQUITY
For the Years Ended May 31, 2016, 2015 and 2014
Common Stock and
Additional Paid in
Capital
Retained
Earnings
Accumulated
Other
Comprehensive
Loss
Total
Oracle
Corporation
Stockholders’
Equity
Noncontrolling
Interests
Total
Equity
(in millions)
Number of
Shares Amount
Balances as of May 31, 2013 4,646 $ 18,893 $ 25,854 $ (99) $ 44,648 $ 497 $ 45,145
Common stock issued under stock-based compensation plans 95 2,046 — — 2,046 — 2,046
Common stock issued under stock purchase plans 3 109 — — 109 — 109
Assumption of stock-based compensation plan awards in connection with acquisitions — 148 — — 148 — 148
Stock-based compensation — 805 — — 805 — 805
Repurchase of common stock (280) (1,160) (8,638) — (9,798) — (9,798)
Shares repurchased for tax withholdings upon vesting of restricted stock-based awards — (20) — — (20) — (20)
Cash dividends declared ($0.48 per share) — — (2,178) — (2,178) — (2,178)
Tax benefit from stock plans — 254 — — 254 — 254
Other, net — 2 (28) — (26) 12 (14)
Distributions to noncontrolling interests — — — — — (28) (28)
Other comprehensive loss, net — — — (65) (65) (10) (75)
Net income — — 10,955 — 10,955 98 11,053
Balances as of May 31, 2014 4,464 21,077 25,965 (164) 46,878 569 47,447
Common stock issued under stock-based compensation plans 70 1,702 — — 1,702 — 1,702
Common stock issued under stock purchase plans 3 114 — — 114 — 114
Assumption of stock-based compensation plan awards in connection with acquisitions — 12 — — 12 — 12
Stock-based compensation — 933 — — 933 — 933
Repurchase of common stock (194) (943) (7,145) — (8,088) — (8,088)
Shares repurchased for tax withholdings upon vesting of restricted stock-based awards — (14) — — (14) — (14)
Cash dividends declared ($0.51 per share) — — (2,255) — (2,255) — (2,255)
Tax benefit from stock plans — 267 — — 267 — 267
Other, net — 8 — — 8 15 23
Distributions to noncontrolling interests — — — — — (196) (196)
Other comprehensive loss, net — — — (832) (832) (66) (898)
Net income — — 9,938 — 9,938 113 10,051
Balances as of May 31, 2015 4,343 23,156 26,503 (996) 48,663 435 49,098
Common stock issued under stock-based compensation plans 60 1,304 — — 1,304 — 1,304
Common stock issued under stock purchase plans 3 121 — — 121 — 121
Assumption of stock-based compensation plan awards in connection with acquisitions — 1 — — 1 — 1
Stock-based compensation — 1,037 — — 1,037 — 1,037
Repurchase of common stock (272) (1,464) (8,975) — (10,439) — (10,439)
Shares repurchased for tax withholdings upon vesting of restricted stock-based awards (3) (89) — — (89) — (89)
Cash dividends declared ($0.60 per share) — — (2,541) — (2,541) — (2,541)
Tax benefit from stock plans — 141 — — 141 — 141
Other, net — 10 — — 10 9 19
Distributions to noncontrolling interests — — — — — (85) (85)
Other comprehensive gain, net — — — 180 180 26 206
Net income — — 8,901 — 8,901 116 9,017
Balances as of May 31, 2016 4,131 $ 24,217 $ 23,888 $ (816) $ 47,289 $ 501 $ 47,790
See notes to consolidated financial statements.
89