Oracle 2015 Annual Report Download - page 74
Download and view the complete annual report
Please find page 74 of the 2015 Oracle annual report below. You can navigate through the pages in the report by either clicking on the pages listed below, or by using the keyword search tool below to find specific information within the annual report.-
 1
1 -
2
-
3
-
4
-
5
-
6
-
7
-
8
-
9
-
10
-
11
-
12
-
13
-
14
-
15
-
16
-
17
-
18
-
19
-
20
-
21
-
22
-
23
-
24
-
25
-
26
-
27
-
28
-
29
-
30
-
31
-
32
-
33
-
34
-
35
-
36
-
37
-
38
-
39
-
40
-
41
-
42
-
43
-
44
-
45
-
46
-
47
-
48
-
49
-
50
-
51
-
52
-
53
-
54
-
55
-
56
-
57
-
58
-
59
-
60
-
61
-
62
-
63
-
 64
64 -
 65
65 -
 66
66 -
 67
67 -
 68
68 -
 69
69 -
 70
70 -
 71
71 -
 72
72 -
 73
73 -
 74
74 -
 75
75 -
 76
76 -
 77
77 -
 78
78 -
 79
79 -
 80
80 -
 81
81 -
 82
82 -
 83
83 -
 84
84 -
85
-
86
-
87
-
88
-
89
-
90
-
91
-
92
-
93
-
94
-
95
-
96
-
97
-
98
-
99
-
100
-
101
-
102
-
103
-
104
-
105
-
106
-
107
-
108
-
109
-
110
-
111
-
112
-
113
-
114
-
115
-
116
-
117
-
118
-
119
-
120
-
121
-
122
-
123
-
124
-
125
-
126
-
127
-
128
-
129
-
130
-
131
-
132
-
133
-
134
-
135
-
136
-
137
-
138
-
139
-
140
-
141
-
142
-
143
-
144
-
145
-
146
-
147
-
148
-
149
-
150
-
151
-
152
-
153
-
154
-
155
 |
 |

Table of Contents
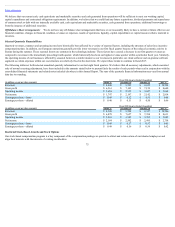
Net cash provided by operating activities decreased in fiscal 2016 and 2015 primarily due to the cash unfavorable effects of lower net income and the related
unfavorable currency rate fluctuations on our net income in each fiscal year relative to the corresponding prior year period.
Cash flows from investing activities: The changes in cash flows from investing activities primarily relate to our acquisitions, the timing of our purchases,
maturities and sales of our investments in marketable debt securities and investments in capital and other assets, including certain intangible assets, to support our
growth.
Fiscal2016ComparedtoFiscal2015:Net cash used for investing activities decreased in fiscal 2016 relative to fiscal 2015 primarily due to a decrease in net
cash used to purchase marketable securities (net of proceeds received from sales and maturities) and a decrease in cash used for acquisitions, net of cash acquired.
Fiscal2015ComparedtoFiscal2014:Net cash used for investing activities increased in fiscal 2015 relative to fiscal 2014 primarily due to an increase in cash
used for acquisitions, net of cash acquired, and an increase in net cash used to purchase marketable securities (net of proceeds received from sales and maturities).
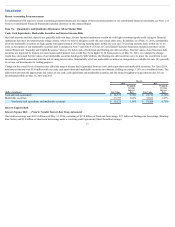
Cash flows from financing activities: The changes in cash flows from financing activities primarily relate to borrowings and repayments related to our debt
instruments as well as stock repurchases, dividend payments and net proceeds related to employee stock programs.
Fiscal2016ComparedtoFiscal2015:We used net cash for financing activities of $9.9 billion during fiscal 2016 in comparison to net cash provided by
financing activities of $9.9 billion during fiscal 2015. Cash used in financing activities during fiscal 2016 was primarily due to cash outflows of $10.4 billion for
fiscal 2016 common stock repurchases and $2.5 billion for fiscal 2016 dividend payments, partially offset by $1.8 billion of cash inflows from fiscal 2016 debt
issuances, net of repayments. Cash provided by financing activities of $9.9 billion during fiscal 2015 was primarily due to $18.3 billion of net cash inflows from
fiscal 2015 debt issuances, net of repayments, partially offset by $8.1 billion of cash used for fiscal 2015 common stock repurchases and $2.3 billion of cash used
for fiscal 2015 dividend payments.
Fiscal2015ComparedtoFiscal2014:Net cash provided by financing activities in fiscal 2015 increased in comparison to net cash used by financing activities in
fiscal 2014 primarily due to a net increase in borrowings in fiscal 2015 as well as lower stock repurchase activity during fiscal 2015. These favorable impacts to our
financing cash flows during fiscal 2015 were partially offset by the repayment of $1.5 billion of borrowings pursuant to senior notes maturities during fiscal 2015
(no repayments during fiscal 2014).
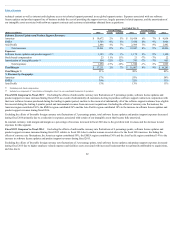
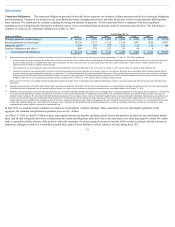
Free cash flow: To supplement our statements of cash flows presented on a GAAP basis, we use non-GAAP measures of cash flows on a trailing 4-quarter basis
to analyze cash flows generated from our operations. We believe free cash flow is also useful as one of the bases for comparing our performance with our
competitors. The presentation of non-GAAP free cash flow is not meant to be considered in isolation or as an alternative to net income as an indicator of our
performance, or as an alternative to cash flows from operating activities as a measure of liquidity. We calculate free cash flow as follows:
Year Ended May 31,
(Dollars in millions) 2016 Change 2015 Change 2014
Net cash provided by operating activities $ 13,561 -5% $ 14,336 -4% $ 14,921
Capital expenditures (1,189) -15% (1,391) 140% (580)
Free cash flow $ 12,372 -4% $ 12,945 -10% $ 14,341
Net income $ 8,901 $ 9,938 $ 10,955
Free cash flow as percent of net income 139% 130% 131%
72