Oracle 2015 Annual Report Download - page 132
Download and view the complete annual report
Please find page 132 of the 2015 Oracle annual report below. You can navigate through the pages in the report by either clicking on the pages listed below, or by using the keyword search tool below to find specific information within the annual report.-
 1
1 -
2
-
3
-
4
-
5
-
6
-
7
-
8
-
9
-
10
-
11
-
12
-
13
-
14
-
15
-
16
-
17
-
18
-
19
-
20
-
21
-
22
-
23
-
24
-
25
-
26
-
27
-
28
-
29
-
30
-
31
-
32
-
33
-
34
-
35
-
36
-
37
-
38
-
39
-
40
-
41
-
42
-
43
-
44
-
45
-
46
-
47
-
48
-
49
-
50
-
51
-
52
-
53
-
54
-
55
-
56
-
57
-
58
-
59
-
60
-
61
-
62
-
63
-
64
-
65
-
66
-
67
-
68
-
69
-
70
-
71
-
72
-
73
-
74
-
75
-
76
-
77
-
78
-
79
-
80
-
81
-
82
-
83
-
84
-
85
-
86
-
87
-
88
-
89
-
90
-
91
-
92
-
93
-
94
-
95
-
96
-
97
-
98
-
99
-
100
-
101
-
102
-
103
-
104
-
105
-
106
-
107
-
108
-
109
-
110
-
111
-
112
-
113
-
114
-
115
-
116
-
117
-
118
-
119
-
120
-
121
-
 122
122 -
 123
123 -
 124
124 -
 125
125 -
 126
126 -
 127
127 -
 128
128 -
 129
129 -
 130
130 -
 131
131 -
 132
132 -
 133
133 -
 134
134 -
 135
135 -
 136
136 -
 137
137 -
 138
138 -
 139
139 -
 140
140 -
 141
141 -
 142
142 -
143
-
144
-
145
-
146
-
147
-
148
-
149
-
150
-
151
-
152
-
153
-
154
-
155
 |
 |

Table of Contents
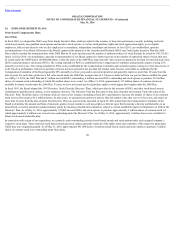
ORACLE CORPORATION
NOTES TO CONSOLIDATED FINANCIAL STATEMENTS—(Continued)
May 31, 2016
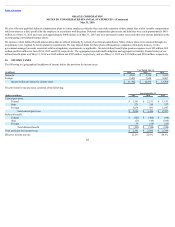
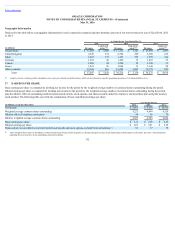
Year Ended May 31,
(in millions) 2016 2015 2014
Cloud software and on-premise software:
Revenues $ 9,488 $ 10,025 $ 10,542
Cloud software as a service and platform as a service expenses 1,116 742 437
Sales and distribution expenses 6,010 5,812 5,666
Margin $ 2,362 $ 3,471 $ 4,439
Cloud infrastructure as a service:
Revenues $ 646 $ 608 $ 456
Cloud infrastructure as a service expenses 352 329 304
Sales and distribution expenses 74 89 61
Margin $ 220 $ 190 $ 91
Software license updates and product support:
Revenues $ 18,863 $ 18,858 $ 18,209
Software license updates and product support expenses 1,077 1,130 1,111
Margin $ 17,786 $ 17,728 $ 17,098
Total cloud and on-premise software business:
Revenues $ 28,997 $ 29,491 $ 29,207
Expenses 8,629 8,102 7,579
Margin $ 20,368 $ 21,389 $ 21,628
Hardware products:
Revenues $ 2,471 $ 2,825 $ 2,976
Hardware products expenses 1,364 1,465 1,516
Sales and distribution expenses 850 864 940
Margin $ 257 $ 496 $ 520
Hardware support:
Revenues $ 2,198 $ 2,384 $ 2,407
Hardware support expenses 665 783 802
Margin $ 1,533 $ 1,601 $ 1,605
Total hardware business:
Revenues $ 4,669 $ 5,209 $ 5,383
Expenses 2,879 3,112 3,258
Margin $ 1,790 $ 2,097 $ 2,125
Total services business:
Revenues $ 3,391 $ 3,553 $ 3,716
Services expenses 2,645 2,818 2,822
Margin $ 746 $ 735 $ 894
Totals:
Revenues $ 37,057 $ 38,253 $ 38,306
Expenses 14,153 14,032 13,659
Margin $ 22,904 $ 24,221 $ 24,647
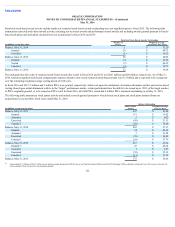
Cloud software and on-premise software, software license updates and product support and hardware support revenues for management reporting included revenues related to cloud SaaS and PaaS, software
support and hardware support contracts that would have otherwise been recorded by the acquired businesses as independent entities but were not recognized in our consolidated statements of operations for
the periods presented. See Note 10 for an explanation of these adjustments and the table below for a reconciliation of our total operating
130
(1)
(2)
(2)
(1)
(2)
(1)
(2)
(2)
(1)
(2)
(1)
(2)
(1)
(2)
(1)
(2)
(1)