Oracle 2015 Annual Report Download - page 111
Download and view the complete annual report
Please find page 111 of the 2015 Oracle annual report below. You can navigate through the pages in the report by either clicking on the pages listed below, or by using the keyword search tool below to find specific information within the annual report.-
 1
1 -
2
-
3
-
4
-
5
-
6
-
7
-
8
-
9
-
10
-
11
-
12
-
13
-
14
-
15
-
16
-
17
-
18
-
19
-
20
-
21
-
22
-
23
-
24
-
25
-
26
-
27
-
28
-
29
-
30
-
31
-
32
-
33
-
34
-
35
-
36
-
37
-
38
-
39
-
40
-
41
-
42
-
43
-
44
-
45
-
46
-
47
-
48
-
49
-
50
-
51
-
52
-
53
-
54
-
55
-
56
-
57
-
58
-
59
-
60
-
61
-
62
-
63
-
64
-
65
-
66
-
67
-
68
-
69
-
70
-
71
-
72
-
73
-
74
-
75
-
76
-
77
-
78
-
79
-
80
-
81
-
82
-
83
-
84
-
85
-
86
-
87
-
88
-
89
-
90
-
91
-
92
-
93
-
94
-
95
-
96
-
97
-
98
-
99
-
100
-
 101
101 -
 102
102 -
 103
103 -
 104
104 -
 105
105 -
 106
106 -
 107
107 -
 108
108 -
 109
109 -
 110
110 -
 111
111 -
 112
112 -
 113
113 -
 114
114 -
 115
115 -
 116
116 -
 117
117 -
 118
118 -
 119
119 -
 120
120 -
 121
121 -
122
-
123
-
124
-
125
-
126
-
127
-
128
-
129
-
130
-
131
-
132
-
133
-
134
-
135
-
136
-
137
-
138
-
139
-
140
-
141
-
142
-
143
-
144
-
145
-
146
-
147
-
148
-
149
-
150
-
151
-
152
-
153
-
154
-
155
 |
 |
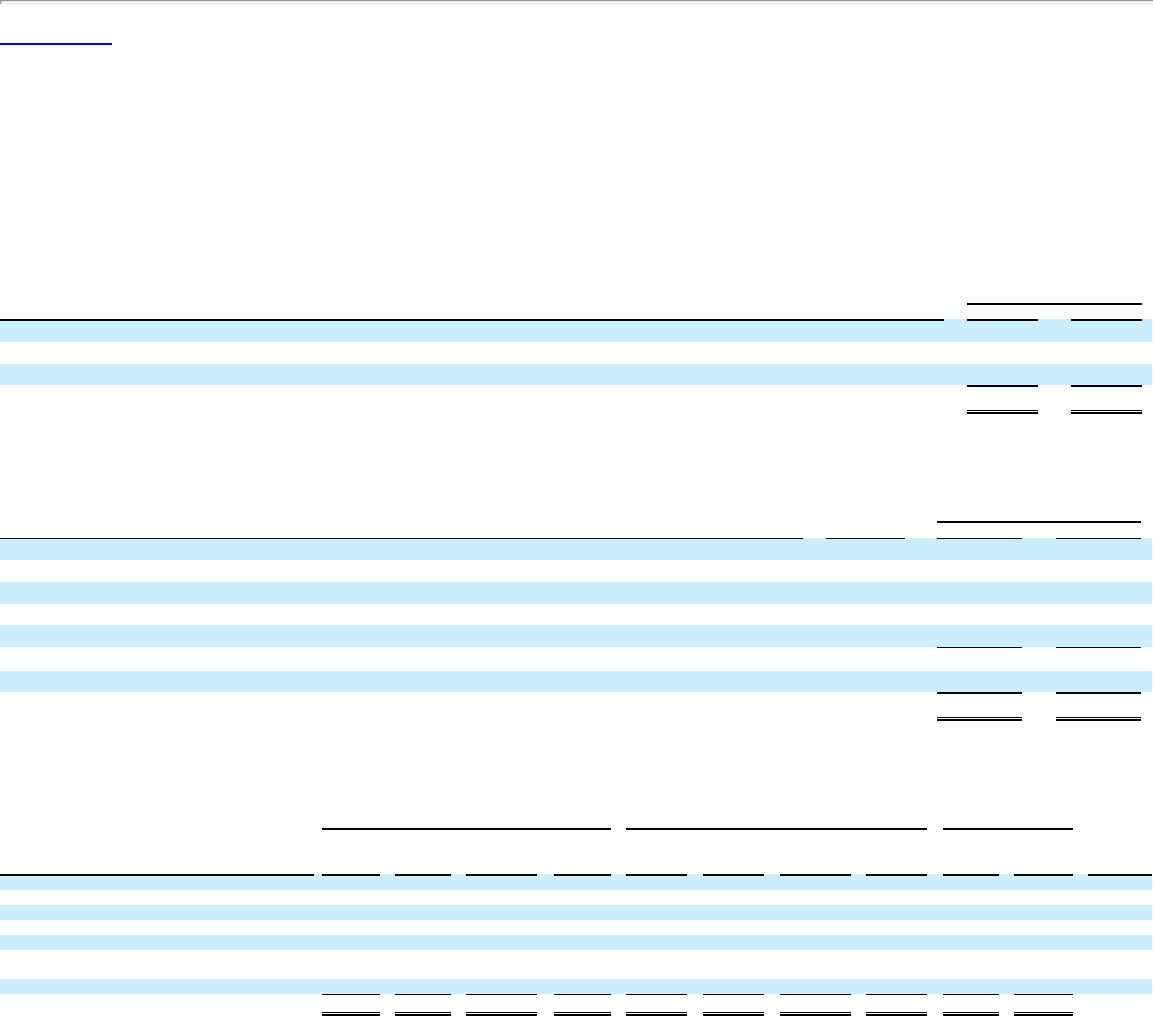
Table of Contents
ORACLE CORPORATION
NOTES TO CONSOLIDATED FINANCIAL STATEMENTS—(Continued)
May 31, 2016
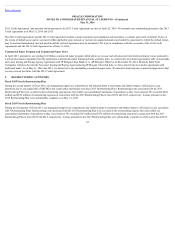
fair values of our senior notes the related fair value hedges using Level 2 inputs at May 31, 2016 and 2015 were $43.2 billion and $44.1 billion, respectively. As
of May 31, 2016, the estimated fair value of our $3.8 billion of short-term borrowings approximates carrying value due to the short maturity of the borrowings.
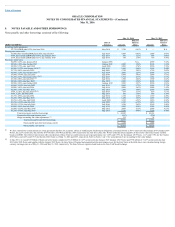
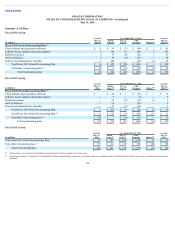
5. INVENTORIES
Inventories consisted of the following:
May 31,
(in millions) 2016 2015
Raw materials $ 95 $ 112
Work-in-process 31 38
Finished goods 86 164
Total $ 212 $ 314
6. PROPERTY, PLANT AND EQUIPMENT
Property, plant and equipment, net consisted of the following:
Estimated
Useful Life
May 31,
(Dollars in millions) 2016 2015
Computer, network, machinery and equipment 1-5 years $ 3,927 $ 3,345
Buildings and improvements 1-40 years 2,754 2,721
Furniture, fixtures and other 5-15 years 574 547
Land — 744 589
Construction in progress — 97 93
Total property, plant and equipment 1-40 years 8,096 7,295
Accumulated depreciation (4,096) (3,609)
Total property, plant and equipment, net $ 4,000 $ 3,686
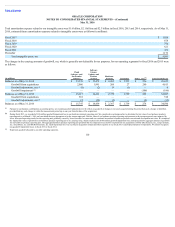
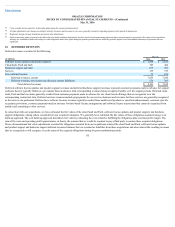
7. INTANGIBLE ASSETS AND GOODWILL
The changes in intangible assets for fiscal 2016 and the net book value of intangible assets as of May 31, 2016 and 2015 were as follows:
Intangible Assets, Gross Accumulated Amortization Intangible Assets, Net Weighted-
Average
Useful
Life (Dollars in millions)
May 31,
2015 Additions Retirements
May 31,
2016
May 31,
2015 Expense Retirements
May 31,
2016
May 31,
2015
May 31,
2016
Software support agreements and related relationships $ 4,190 $ — $ (1,771) $ 2,419 $ (2,700) $ (358) $ 1,771 $ (1,287) $ 1,490 $ 1,132 N.A
Hardware support agreements and related relationships 1,012 — (2) 1,010 (654) (145) 2 (797) 358 213 N.A
Developed technology 4,602 97 (1,038) 3,661 (2,355) (559) 1,038 (1,876) 2,247 1,785 5 years
Core technology 552 — — 552 (411) (89) — (500) 141 52 N.A
Customer relationships and contract backlog 2,197 8 (806) 1,399 (1,710) (217) 806 (1,121) 487 278 3 years
SaaS, PaaS and IaaS agreements and related relationships
and other 1,993 57 (16) 2,034 (508) (212) 16 (704) 1,485 1,330 10 years
Trademarks 501 13 (23) 491 (303) (58) 23 (338) 198 153 5 years
Total intangible assets, net $ 15,047 $ 175 $ (3,656) $ 11,566 $ (8,641) $ (1,638) $ 3,656 $ (6,623) $ 6,406 $ 4,943 7 years
Represents weighted-average useful lives of intangible assets acquired during fiscal 2016
109
(1)
(1)