Oracle 2015 Annual Report Download - page 60
Download and view the complete annual report
Please find page 60 of the 2015 Oracle annual report below. You can navigate through the pages in the report by either clicking on the pages listed below, or by using the keyword search tool below to find specific information within the annual report.-
 1
1 -
2
-
3
-
4
-
5
-
6
-
7
-
8
-
9
-
10
-
11
-
12
-
13
-
14
-
15
-
16
-
17
-
18
-
19
-
20
-
21
-
22
-
23
-
24
-
25
-
26
-
27
-
28
-
29
-
30
-
31
-
32
-
33
-
34
-
35
-
36
-
37
-
38
-
39
-
40
-
41
-
42
-
43
-
44
-
45
-
46
-
47
-
48
-
49
-
 50
50 -
 51
51 -
 52
52 -
 53
53 -
 54
54 -
 55
55 -
 56
56 -
 57
57 -
 58
58 -
 59
59 -
 60
60 -
 61
61 -
 62
62 -
 63
63 -
 64
64 -
 65
65 -
 66
66 -
 67
67 -
 68
68 -
 69
69 -
 70
70 -
71
-
72
-
73
-
74
-
75
-
76
-
77
-
78
-
79
-
80
-
81
-
82
-
83
-
84
-
85
-
86
-
87
-
88
-
89
-
90
-
91
-
92
-
93
-
94
-
95
-
96
-
97
-
98
-
99
-
100
-
101
-
102
-
103
-
104
-
105
-
106
-
107
-
108
-
109
-
110
-
111
-
112
-
113
-
114
-
115
-
116
-
117
-
118
-
119
-
120
-
121
-
122
-
123
-
124
-
125
-
126
-
127
-
128
-
129
-
130
-
131
-
132
-
133
-
134
-
135
-
136
-
137
-
138
-
139
-
140
-
141
-
142
-
143
-
144
-
145
-
146
-
147
-
148
-
149
-
150
-
151
-
152
-
153
-
154
-
155
 |
 |

Table of Contents
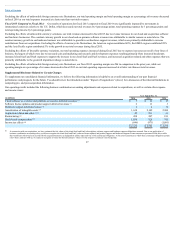
Represents the amortization of intangible assets, substantially all of which were acquired in connection with our acquisitions. As of May 31, 2016, estimated future amortization expenses related to intangible
assets were as follows (in millions):
Fiscal 2017 $ 1,026
Fiscal 2018 878
Fiscal 2019 770
Fiscal 2020 621
Fiscal 2021 476
Thereafter 1,172
Total intangible assets, net $ 4,943
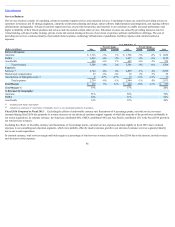
Acquisition related and other expenses primarily consist of personnel related costs for transitional and certain other employees, stock-based compensation expenses, integration related professional services,
certain business combination adjustments including certain adjustments after the measurement period has ended and certain other operating items, net. Included in acquisition related and other expenses for
fiscal 2015 was a goodwill impairment loss of $186 million (see Note 7 of Notes to Consolidated Financial Statements included elsewhere in this Annual Report).
Restructuring expenses during fiscal 2016 primarily related to employee severance in connection with our 2015 Restructuring Plan. Restructuring expenses during fiscal 2015 primarily related to costs
incurred pursuant to our 2015 Restructuring Plan and our Fiscal 2013 Oracle Restructuring Plan (2013 Restructuring Plan). Restructuring expenses during fiscal 2014 primarily related to costs incurred
pursuant to our 2013 Restructuring Plan. Additional information regarding certain of our restructuring plans is provided in Note 9 of Notes to Consolidated Financial Statements included elsewhere in this
Annual Report.
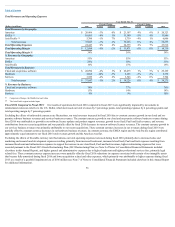
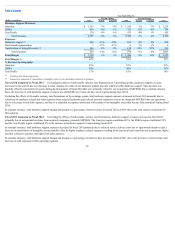
Stock-based compensation was included in the following operating expense line items of our consolidated statements of operations (in millions):
Year Ended May 31,
2016 2015 2014
Sales and marketing $ 220 $ 180 $ 165
Cloud software as a service and platform as a service 17 10 8
Cloud infrastructure as a service 4 5 4
Software license updates and product support 23 21 22
Hardware products 7 6 5
Hardware support 5 6 6
Services 29 30 29
Research and development 609 522 385
General and administrative 120 148 171
Subtotal 1,034 928 795
Acquisition related and other 3 5 10
Total stock-based compensation $ 1,037 $ 933 $ 805
Stock-based compensation included in acquisition related and other expenses resulted from unvested stock options and restricted stock-based awards assumed from acquisitions whose vesting was
accelerated upon termination of the employees pursuant to the terms of those stock options and restricted stock-based awards.
The income tax effects presented were calculated as if the above described charges were not included in our results of operations for each of the respective periods presented. Income tax effects for fiscal
2016, 2015 and 2014 were calculated based on the applicable jurisdictional tax rates applied to the items within the table above and resulted in effective tax rates of 23.2%, 23.6% and 22.5%, respectively,
instead of 22.2%, 22.6% and 20.1%, respectively, which represented our effective tax rates as derived per our consolidated statements of operations, primarily due to the net tax effects of acquisition related
items, including the tax effects of amortization of intangible assets.
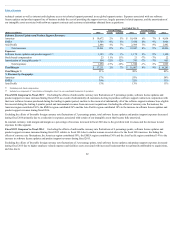
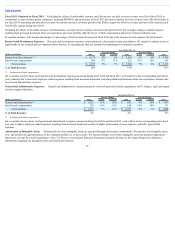
Cloud and On-Premise Software Business
Our cloud and on-premise software business consists of our cloud software and on-premise software segment, our cloud IaaS segment and our software license
updates and product support segment.
Cloud Software and On-Premise Software: Our cloud software and on-premise software segment engages in the sale, marketing and delivery of our cloud
software offerings, including our cloud SaaS and PaaS offerings, and the licensing of our software for on-premise IT environments. Our cloud SaaS and PaaS
offerings grant customers access to a broad range of our application and platform software technologies on a subscription basis in a secure, standards-based, cloud
computing environment that generally includes access, hosting, infrastructure
58
(2)
(3)
(4)
(5)
(6)