Oracle 2015 Annual Report Download - page 134
Download and view the complete annual report
Please find page 134 of the 2015 Oracle annual report below. You can navigate through the pages in the report by either clicking on the pages listed below, or by using the keyword search tool below to find specific information within the annual report.-
 1
1 -
2
-
3
-
4
-
5
-
6
-
7
-
8
-
9
-
10
-
11
-
12
-
13
-
14
-
15
-
16
-
17
-
18
-
19
-
20
-
21
-
22
-
23
-
24
-
25
-
26
-
27
-
28
-
29
-
30
-
31
-
32
-
33
-
34
-
35
-
36
-
37
-
38
-
39
-
40
-
41
-
42
-
43
-
44
-
45
-
46
-
47
-
48
-
49
-
50
-
51
-
52
-
53
-
54
-
55
-
56
-
57
-
58
-
59
-
60
-
61
-
62
-
63
-
64
-
65
-
66
-
67
-
68
-
69
-
70
-
71
-
72
-
73
-
74
-
75
-
76
-
77
-
78
-
79
-
80
-
81
-
82
-
83
-
84
-
85
-
86
-
87
-
88
-
89
-
90
-
91
-
92
-
93
-
94
-
95
-
96
-
97
-
98
-
99
-
100
-
101
-
102
-
103
-
104
-
105
-
106
-
107
-
108
-
109
-
110
-
111
-
112
-
113
-
114
-
115
-
116
-
117
-
118
-
119
-
120
-
121
-
122
-
123
-
 124
124 -
 125
125 -
 126
126 -
 127
127 -
 128
128 -
 129
129 -
 130
130 -
 131
131 -
 132
132 -
 133
133 -
 134
134 -
 135
135 -
 136
136 -
 137
137 -
 138
138 -
 139
139 -
 140
140 -
 141
141 -
 142
142 -
 143
143 -
 144
144 -
145
-
146
-
147
-
148
-
149
-
150
-
151
-
152
-
153
-
154
-
155
 |
 |

Table of Contents
ORACLE CORPORATION
NOTES TO CONSOLIDATED FINANCIAL STATEMENTS—(Continued)
May 31, 2016
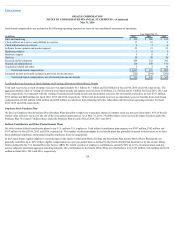
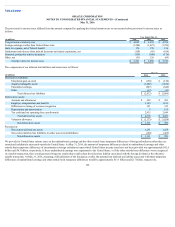
Geographic Information
Disclosed in the table below is geographic information for each country that comprised greater than three percent of our total revenues for any of fiscal 2016, 2015
or 2014.
As of and for the Year Ended May 31,
2016 2015 2014
(in millions) Revenues
Long-Lived
Assets Revenues
Long-Lived
Assets Revenues
Long-Lived
Assets
United States $ 17,264 $ 3,646 $ 17,325 $ 3,341 $ 16,809 $ 2,993
United Kingdom 2,349 334 2,388 309 2,309 236
Japan 1,465 375 1,433 338 1,558 414
Germany 1,438 40 1,466 33 1,483 35
Canada 1,096 44 1,286 58 1,190 31
France 1,039 26 1,044 33 1,148 28
Other countries 12,396 963 13,284 1,007 13,778 879
Total $ 37,047 $ 5,428 $ 38,226 $ 5,119 $ 38,275 $ 4,616
Long-lived assets exclude goodwill, intangible assets, equity investments and deferred taxes, which are not allocated to specific geographic locations as it is impracticable to do so.
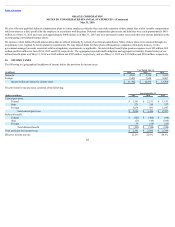
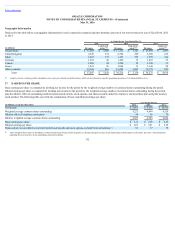
17. EARNINGS PER SHARE
Basic earnings per share is computed by dividing net income for the period by the weighted-average number of common shares outstanding during the period.
Diluted earnings per share is computed by dividing net income for the period by the weighted-average number of common shares outstanding during the period,
plus the dilutive effect of outstanding restricted stock-based awards, stock options, and shares issuable under the employee stock purchase plan using the treasury
stock method. The following table sets forth the computation of basic and diluted earnings per share:
Year Ended May 31,
(in millions, except per share data) 2016 2015 2014
Net income $ 8,901 $ 9,938 $ 10,955
Weighted average common shares outstanding 4,221 4,404 4,528
Dilutive effect of employee stock plans 84 99 76
Dilutive weighted average common shares outstanding 4,305 4,503 4,604
Basic earnings per share $ 2.11 $ 2.26 $ 2.42
Diluted earnings per share $ 2.07 $ 2.21 $ 2.38
Shares subject to anti-dilutive restricted stock-based awards and stock options excluded from calculation 63 37 76
These weighted shares relate to anti-dilutive restricted stock-based awards and stock options as calculated using the treasury stock method and could be dilutive in the future. See Note 14 for information
regarding the exercise prices of our outstanding, unexercised options.
132
(1) (1) (1)
(1)
(1)
(1)