Oracle 2015 Annual Report Download - page 77
Download and view the complete annual report
Please find page 77 of the 2015 Oracle annual report below. You can navigate through the pages in the report by either clicking on the pages listed below, or by using the keyword search tool below to find specific information within the annual report.-
 1
1 -
2
-
3
-
4
-
5
-
6
-
7
-
8
-
9
-
10
-
11
-
12
-
13
-
14
-
15
-
16
-
17
-
18
-
19
-
20
-
21
-
22
-
23
-
24
-
25
-
26
-
27
-
28
-
29
-
30
-
31
-
32
-
33
-
34
-
35
-
36
-
37
-
38
-
39
-
40
-
41
-
42
-
43
-
44
-
45
-
46
-
47
-
48
-
49
-
50
-
51
-
52
-
53
-
54
-
55
-
56
-
57
-
58
-
59
-
60
-
61
-
62
-
63
-
64
-
65
-
66
-
 67
67 -
 68
68 -
 69
69 -
 70
70 -
 71
71 -
 72
72 -
 73
73 -
 74
74 -
 75
75 -
 76
76 -
 77
77 -
 78
78 -
 79
79 -
 80
80 -
 81
81 -
 82
82 -
 83
83 -
 84
84 -
 85
85 -
 86
86 -
 87
87 -
88
-
89
-
90
-
91
-
92
-
93
-
94
-
95
-
96
-
97
-
98
-
99
-
100
-
101
-
102
-
103
-
104
-
105
-
106
-
107
-
108
-
109
-
110
-
111
-
112
-
113
-
114
-
115
-
116
-
117
-
118
-
119
-
120
-
121
-
122
-
123
-
124
-
125
-
126
-
127
-
128
-
129
-
130
-
131
-
132
-
133
-
134
-
135
-
136
-
137
-
138
-
139
-
140
-
141
-
142
-
143
-
144
-
145
-
146
-
147
-
148
-
149
-
150
-
151
-
152
-
153
-
154
-
155
 |
 |

Table of Contents
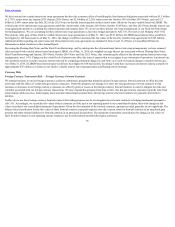
We believe that our current cash, cash equivalents and marketable securities and cash generated from operations will be sufficient to meet our working capital,
capital expenditures and contractual obligation requirements. In addition, we believe that we could fund any future acquisitions, dividend payments and repurchases
of common stock or debt with our internally available cash, cash equivalents and marketable securities, cash generated from operations, additional borrowings or
from the issuance of additional securities.
Off-Balance Sheet Arrangements: We do not have any off-balance sheet arrangements that have or are reasonably likely to have a current or future effect on our
financial condition, changes in financial condition, revenues or expenses, results of operations, liquidity, capital expenditures or capital resources that is material to
investors.
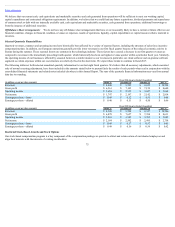
Selected Quarterly Financial Data
Quarterly revenues, expenses and operating income have historically been affected by a variety of seasonal factors, including the structure of sales force incentive
compensation plans. In addition, our European operations generally provide lower revenues in our first fiscal quarter because of the reduced economic activity in
Europe during the summer. These seasonal factors are common in the technology industry. These factors have caused a decrease in our first quarter revenues as
compared to revenues in the immediately preceding fourth quarter, which historically has been our highest revenue quarter within a particular fiscal year. Similarly,
the operating income of our business is affected by seasonal factors in a similar manner as our revenues (in particular, our cloud software and on-premise software
segment) as certain expenses within our cost structure are relatively fixed in the short term. We expect these trends to continue in fiscal 2017.
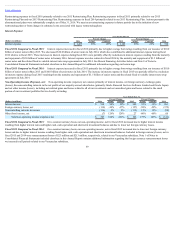
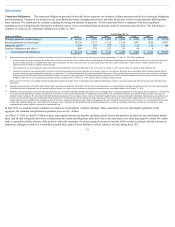
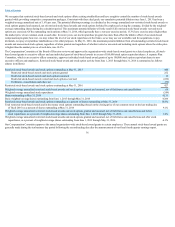
The following tables set forth selected unaudited quarterly information for our last eight fiscal quarters. We believe that all necessary adjustments, which consisted
only of normal recurring adjustments, have been included in the amounts stated below to present fairly the results of such periods when read in conjunction with the
consolidated financial statements and related notes included elsewhere in this Annual Report. The sum of the quarterly financial information may vary from annual
data due to rounding.
Fiscal 2016 Quarter Ended (Unaudited)
(in millions, except per share amounts) August 31 November 30 February 29 May 31
Revenues $ 8,448 $ 8,993 $ 9,012 $ 10,594
Gross profit $ 6,561 $ 7,105 $ 7,139 $ 8,640
Operating income $ 2,654 $ 2,955 $ 3,027 $ 3,968
Net income $ 1,747 $ 2,197 $ 2,142 $ 2,814
Earnings per share—basic $ 0.40 $ 0.52 $ 0.51 $ 0.68
Earnings per share—diluted $ 0.40 $ 0.51 $ 0.50 $ 0.66
Fiscal 2015 Quarter Ended (Unaudited)
(in millions, except per share amounts) August 31 November 30 February 28 May 31
Revenues $ 8,596 $ 9,598 $ 9,327 $ 10,706
Gross profit $ 6,878 $ 7,657 $ 7,394 $ 8,611
Operating income $ 2,963 $ 3,542 $ 3,383 $ 3,982
Net income $ 2,184 $ 2,502 $ 2,495 $ 2,758
Earnings per share—basic $ 0.49 $ 0.57 $ 0.57 $ 0.63
Earnings per share—diluted $ 0.48 $ 0.56 $ 0.56 $ 0.62
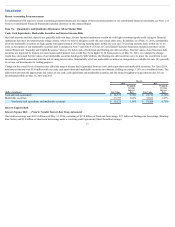
Restricted Stock-Based Awards and Stock Options
Our stock-based compensation program is a key component of the compensation package we provide to attract and retain certain of our talented employees and
align their interests with the interests of existing stockholders.
75