Oracle 2015 Annual Report Download - page 67
Download and view the complete annual report
Please find page 67 of the 2015 Oracle annual report below. You can navigate through the pages in the report by either clicking on the pages listed below, or by using the keyword search tool below to find specific information within the annual report.-
 1
1 -
2
-
3
-
4
-
5
-
6
-
7
-
8
-
9
-
10
-
11
-
12
-
13
-
14
-
15
-
16
-
17
-
18
-
19
-
20
-
21
-
22
-
23
-
24
-
25
-
26
-
27
-
28
-
29
-
30
-
31
-
32
-
33
-
34
-
35
-
36
-
37
-
38
-
39
-
40
-
41
-
42
-
43
-
44
-
45
-
46
-
47
-
48
-
49
-
50
-
51
-
52
-
53
-
54
-
55
-
56
-
 57
57 -
 58
58 -
 59
59 -
 60
60 -
 61
61 -
 62
62 -
 63
63 -
 64
64 -
 65
65 -
 66
66 -
 67
67 -
 68
68 -
 69
69 -
 70
70 -
 71
71 -
 72
72 -
 73
73 -
 74
74 -
 75
75 -
 76
76 -
 77
77 -
78
-
79
-
80
-
81
-
82
-
83
-
84
-
85
-
86
-
87
-
88
-
89
-
90
-
91
-
92
-
93
-
94
-
95
-
96
-
97
-
98
-
99
-
100
-
101
-
102
-
103
-
104
-
105
-
106
-
107
-
108
-
109
-
110
-
111
-
112
-
113
-
114
-
115
-
116
-
117
-
118
-
119
-
120
-
121
-
122
-
123
-
124
-
125
-
126
-
127
-
128
-
129
-
130
-
131
-
132
-
133
-
134
-
135
-
136
-
137
-
138
-
139
-
140
-
141
-
142
-
143
-
144
-
145
-
146
-
147
-
148
-
149
-
150
-
151
-
152
-
153
-
154
-
155
 |
 |

Table of Contents
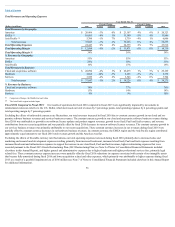
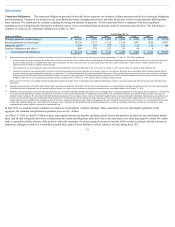
Year Ended May 31,
Percent Change Percent Change
(Dollars in millions) 2016 Actual Constant 2015 Actual Constant 2014
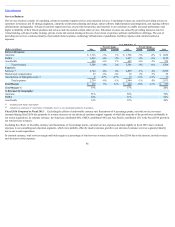
Hardware Support Revenues:
Americas $ 1,163 -7% -4% $ 1,245 1% 3% $ 1,229
EMEA 656 -9% -1% 722 -2% 6% 738
Asia Pacific 378 -9% -1% 413 -4% 1% 429
Total revenues 2,197 -8% -3% 2,380 -1% 4% 2,396
Expenses:
Hardware support 688 -15% -10% 810 -2% 2% 830
Stock-based compensation 5 -17% -17% 6 3% 3% 6
Amortization of intangible assets 146 -8% -8% 158 -32% -32% 231
Total expenses 839 -14% -10% 974 -9% -6% 1,067
Total Margin $ 1,358 -3% 3% $ 1,406 6% 11% $ 1,329
Total Margin % 62% 59% 55%
% Revenues by Geography:
Americas 53% 52% 51%
EMEA 30% 30% 31%
Asia Pacific 17% 18% 18%
Excluding stock-based compensation
Included as a component of ‘Amortization of Intangible Assets’ in our consolidated statements of operations
Fiscal 2016 Compared to Fiscal 2015: Excluding the effects of unfavorable currency rate fluctuations of 5 percentage points, hardware support revenues
decreased in fiscal 2016 due to reductions in sales volumes of certain of our hardware product lines for which we offer hardware support. This decrease was
partially offset by incremental revenues during the first quarter of fiscal 2016 that were primarily related to our acquisition of MICROS. On a constant currency
basis, the decrease in total hardware support revenues was attributable to revenue declines in all regions during fiscal 2016.
Excluding the effects of favorable currency rate fluctuations of 4 percentage points, total hardware support expenses decreased in fiscal 2016 primarily due to
reductions in employee related and other expenses from reduced headcount and reduced external contractor costs as we integrated MICROS into our operations,
due to a decrease in bad debt expenses, and due to a reduction in expenses associated with certain of our intangible assets that became fully amortized during fiscal
2016.
In constant currency, total hardware support margin and margin as a percentage of total revenues increased in fiscal 2016 due to the total expense reductions for
this segment.
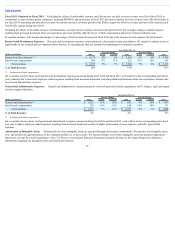
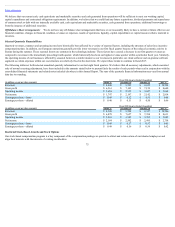
Fiscal 2015 Compared to Fiscal 2014: Excluding the effects of unfavorable currency rate fluctuations, hardware support revenues increased in fiscal 2015
primarily due to incremental revenues from acquired companies, primarily MICROS. The Americas region contributed 42%, the EMEA region contributed 52%
and the Asia Pacific region contributed 6% to the increase in hardware support revenues during fiscal 2015.
In constant currency, total hardware support expenses decreased in fiscal 2015 primarily due to reduced service delivery costs due to operational initiatives and a
decrease in amortization of intangible assets, partially offset by higher employee related expenses resulting from increased headcount from our acquisitions, higher
external contractor expenses and higher bad debt expenses.
In constant currency, total hardware support margin and margin as a percentage of total revenues increased in fiscal 2015 due to the increase in total revenues and
decrease in total expenses for this operating segment.
65
(1)
(2)
(1)
(2)